
















©The Author(s) 2026.
World J Gastroenterol. Jan 7, 2026; 32(1): 113181
Published online Jan 7, 2026. doi: 10.3748/wjg.v32.i1.113181
Published online Jan 7, 2026. doi: 10.3748/wjg.v32.i1.113181
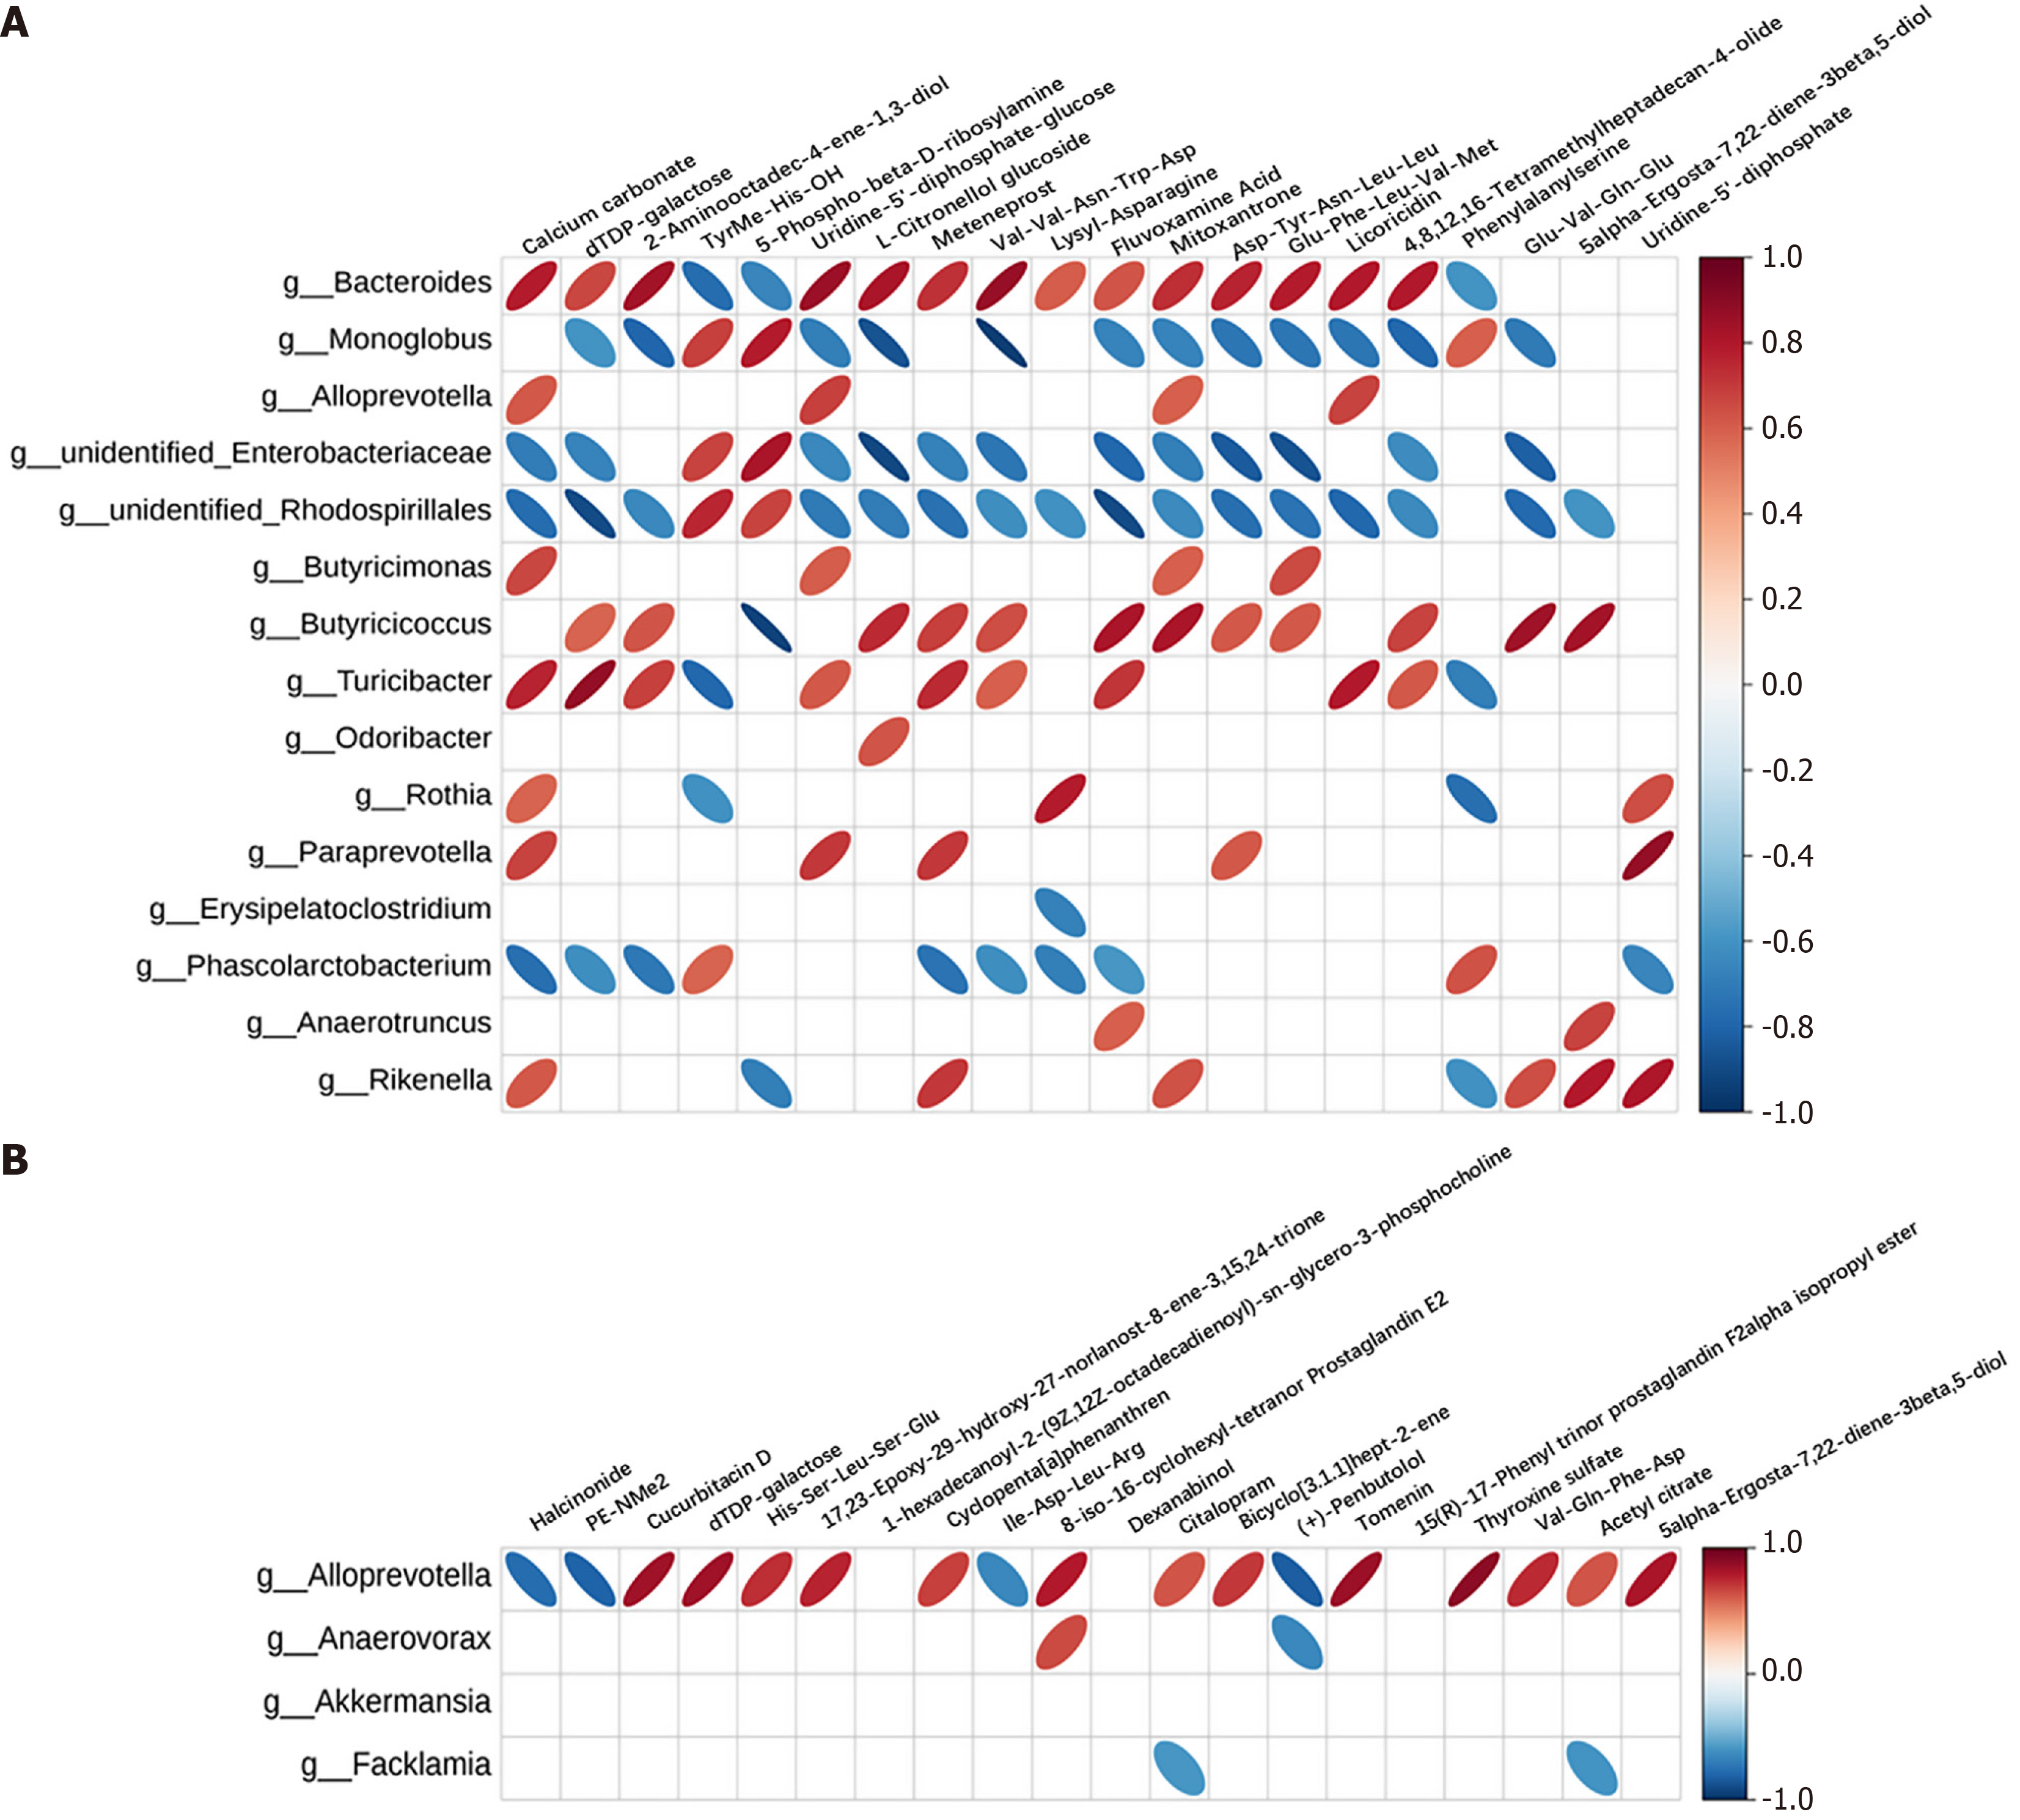
Figure 11 Correlation analysis.
A: Correlation heatmap of top 20 differential metabolites and microorganisms (model group vs normal control group); B: Correlation heatmap of top 20 differential metabolites and microorganisms (Anwei decoction group vs model group). In the correlation heatmap, microorganisms are represented by rows, while metabolites correspond to columns. Positive correlations are indicated by red ellipses, whereas negative correlations are shown with blue ellipses. Ellipse narrowness reflects correlation strength, with narrower ellipses denoting stronger associations. Cells lacking ellipses represent correlations that were not statistically significant (P > 0.05).
- Citation: Qin H, Liu YY, Li Q, Wei SY, Huang LY, Zhou CF, Tan LY, Zhang JW, Wu DK, Tang YM. Anwei decoction alleviates chronic atrophic gastritis by modulating the gut microbiota-metabolite axis and NLRP3 inflammasome activity. World J Gastroenterol 2026; 32(1): 113181
- URL: https://www.wjgnet.com/1007-9327/full/v32/i1/113181.htm
- DOI: https://dx.doi.org/10.3748/wjg.v32.i1.113181