
















©The Author(s) 2026.
World J Gastroenterol. Jan 7, 2026; 32(1): 113181
Published online Jan 7, 2026. doi: 10.3748/wjg.v32.i1.113181
Published online Jan 7, 2026. doi: 10.3748/wjg.v32.i1.113181
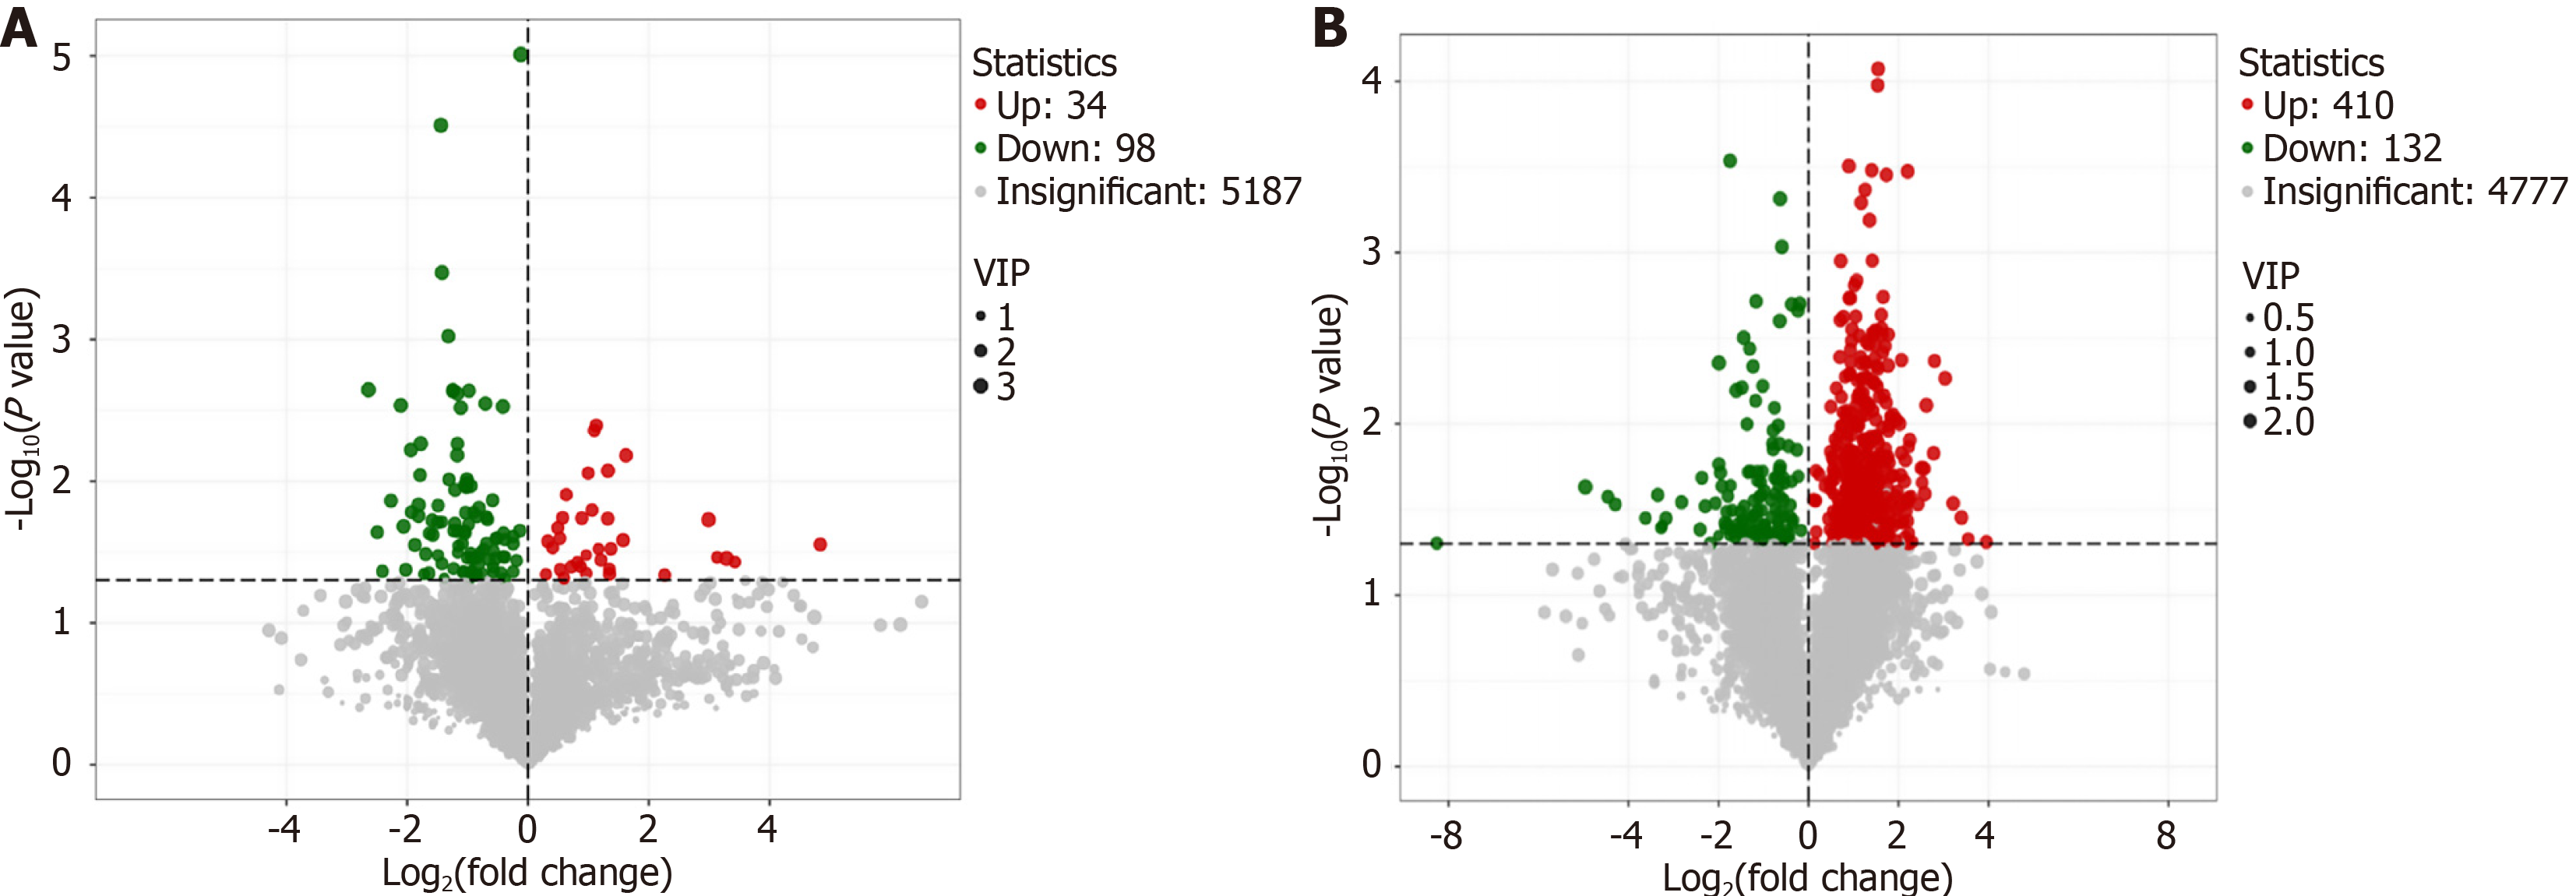
Figure 9 Volcano plots of differential metabolites.
A: Model group vs normal control group; B: Anwei decoction group vs model group. Each dot represents a metabolite, with green dots indicating downregulated metabolites, red dots indicating upregulated metabolites, and gray dots indicating metabolites with no significant difference. VIP: Variable importance in projection.
- Citation: Qin H, Liu YY, Li Q, Wei SY, Huang LY, Zhou CF, Tan LY, Zhang JW, Wu DK, Tang YM. Anwei decoction alleviates chronic atrophic gastritis by modulating the gut microbiota-metabolite axis and NLRP3 inflammasome activity. World J Gastroenterol 2026; 32(1): 113181
- URL: https://www.wjgnet.com/1007-9327/full/v32/i1/113181.htm
- DOI: https://dx.doi.org/10.3748/wjg.v32.i1.113181