
















©The Author(s) 2026.
World J Gastroenterol. Jan 7, 2026; 32(1): 112090
Published online Jan 7, 2026. doi: 10.3748/wjg.v32.i1.112090
Published online Jan 7, 2026. doi: 10.3748/wjg.v32.i1.112090
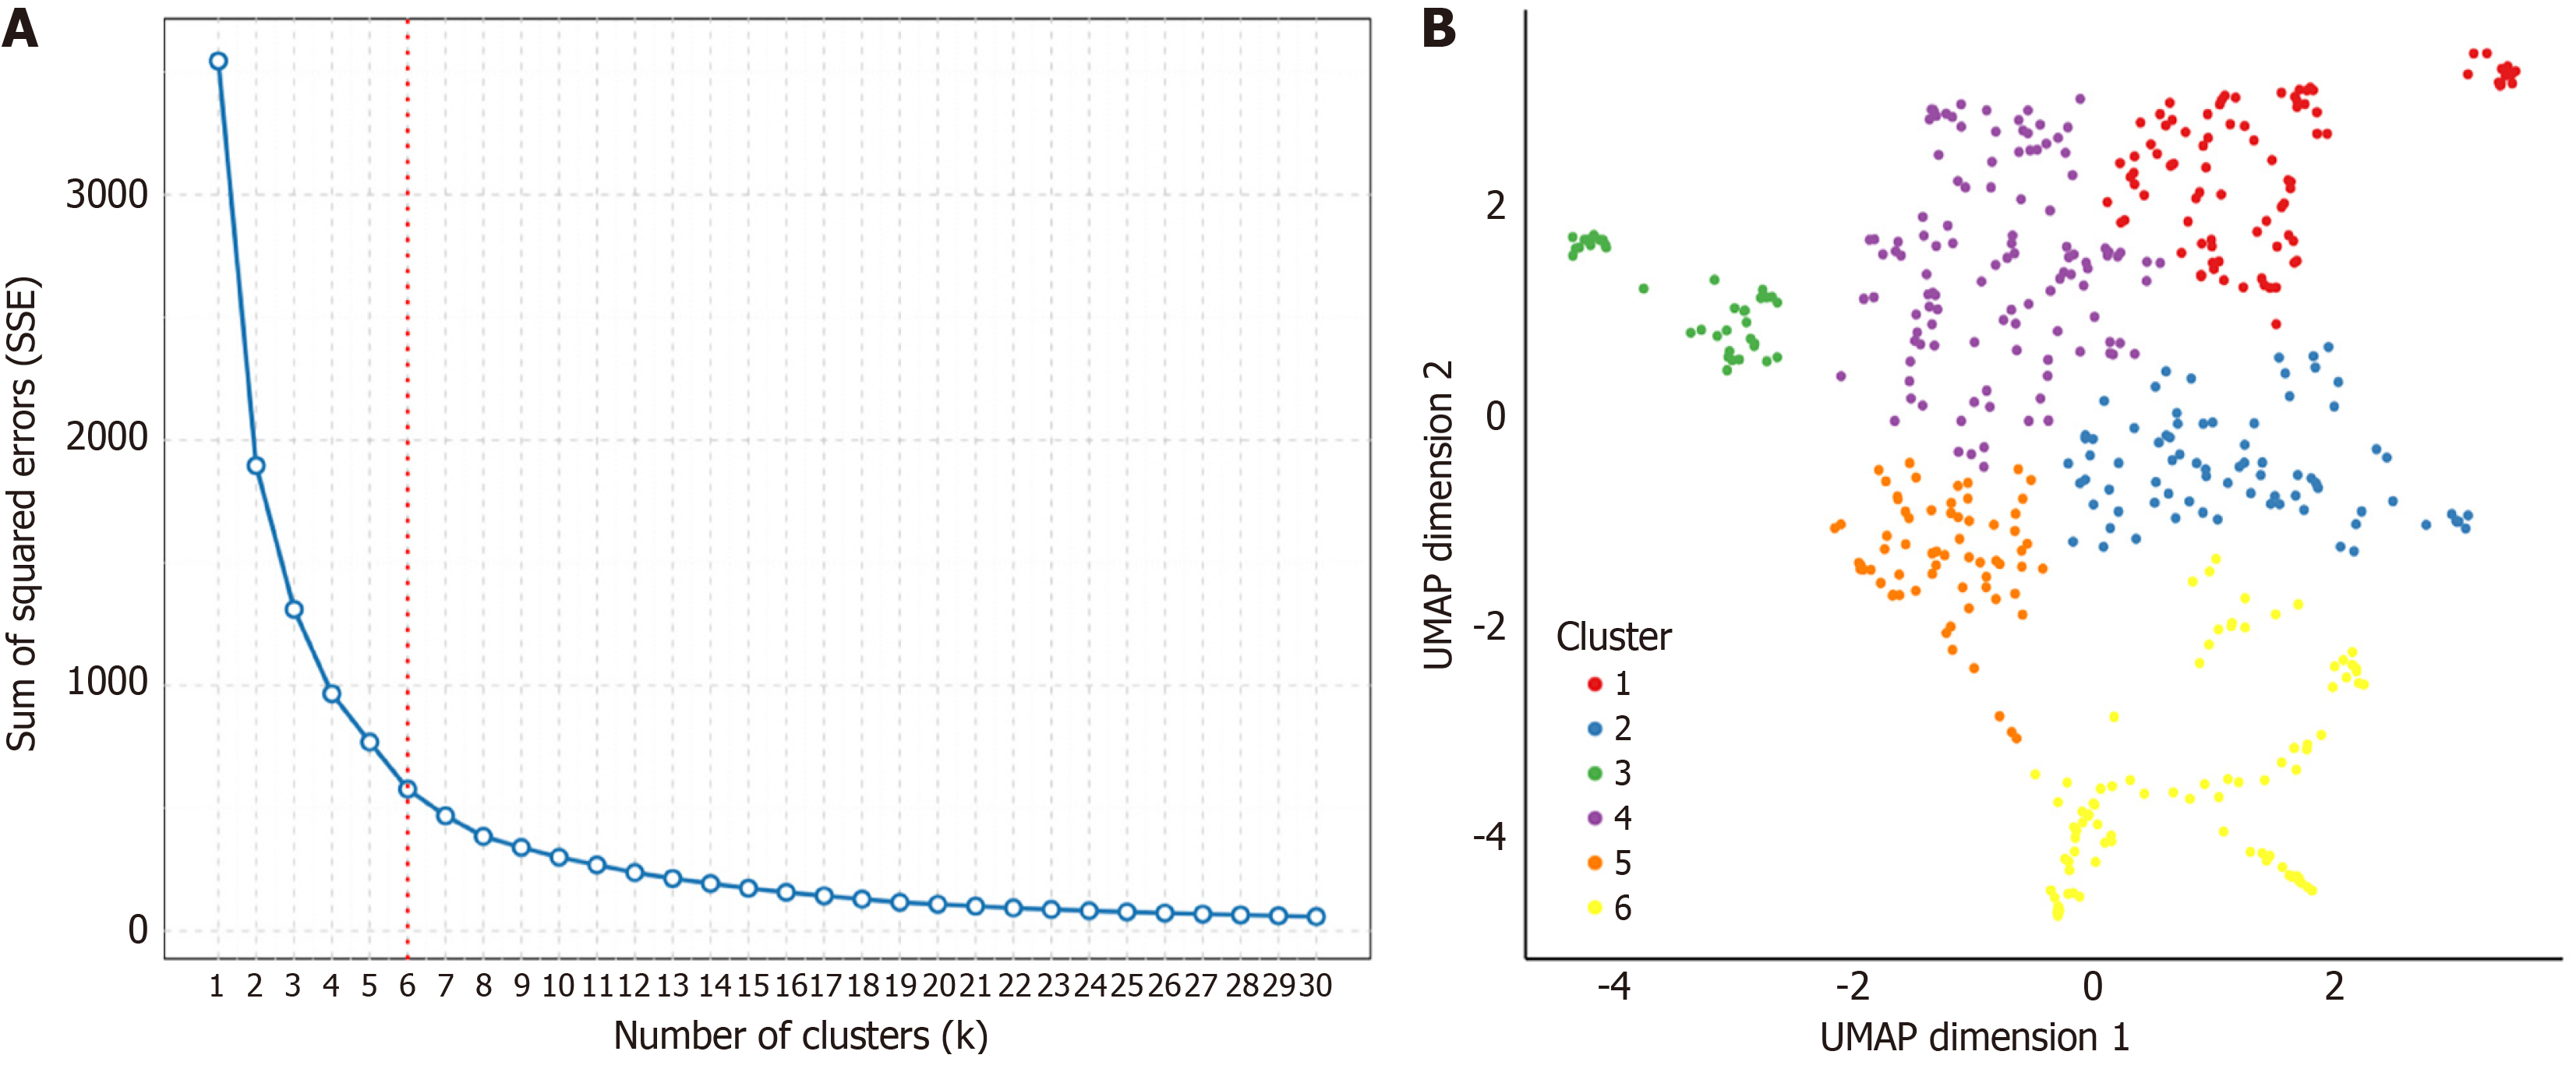
Figure 6 Clustering of high-attention histopathological features to identify morphological patterns.
A: Elbow plot for determining the optimal number of clusters. The sum of squared errors is plotted against the number of clusters (k). The inflection point ("elbow") and the indicator line at k = 6 suggest that six is the optimal number of clusters for this analysis; B: Uniform Manifold Approximation and Projection visualization of high-attention tile embeddings, demonstrating separation into six distinct clusters. Each point represents an individual image tile, and its color denotes assignment to one of the six clusters as defined in the legend. SSE: Sum of Squared Errors; UMAP: Uniform Manifold Approximation and Projection.
- Citation: Zou LF, Wang XB, Li JW, Ouyang X, Luo YY, Luo Y, Wang CL. Predicting lymph node metastasis in colorectal cancer using case-level multiple instance learning. World J Gastroenterol 2026; 32(1): 112090
- URL: https://www.wjgnet.com/1007-9327/full/v32/i1/112090.htm
- DOI: https://dx.doi.org/10.3748/wjg.v32.i1.112090