
















©The Author(s) 2026.
World J Gastroenterol. Jan 7, 2026; 32(1): 112090
Published online Jan 7, 2026. doi: 10.3748/wjg.v32.i1.112090
Published online Jan 7, 2026. doi: 10.3748/wjg.v32.i1.112090
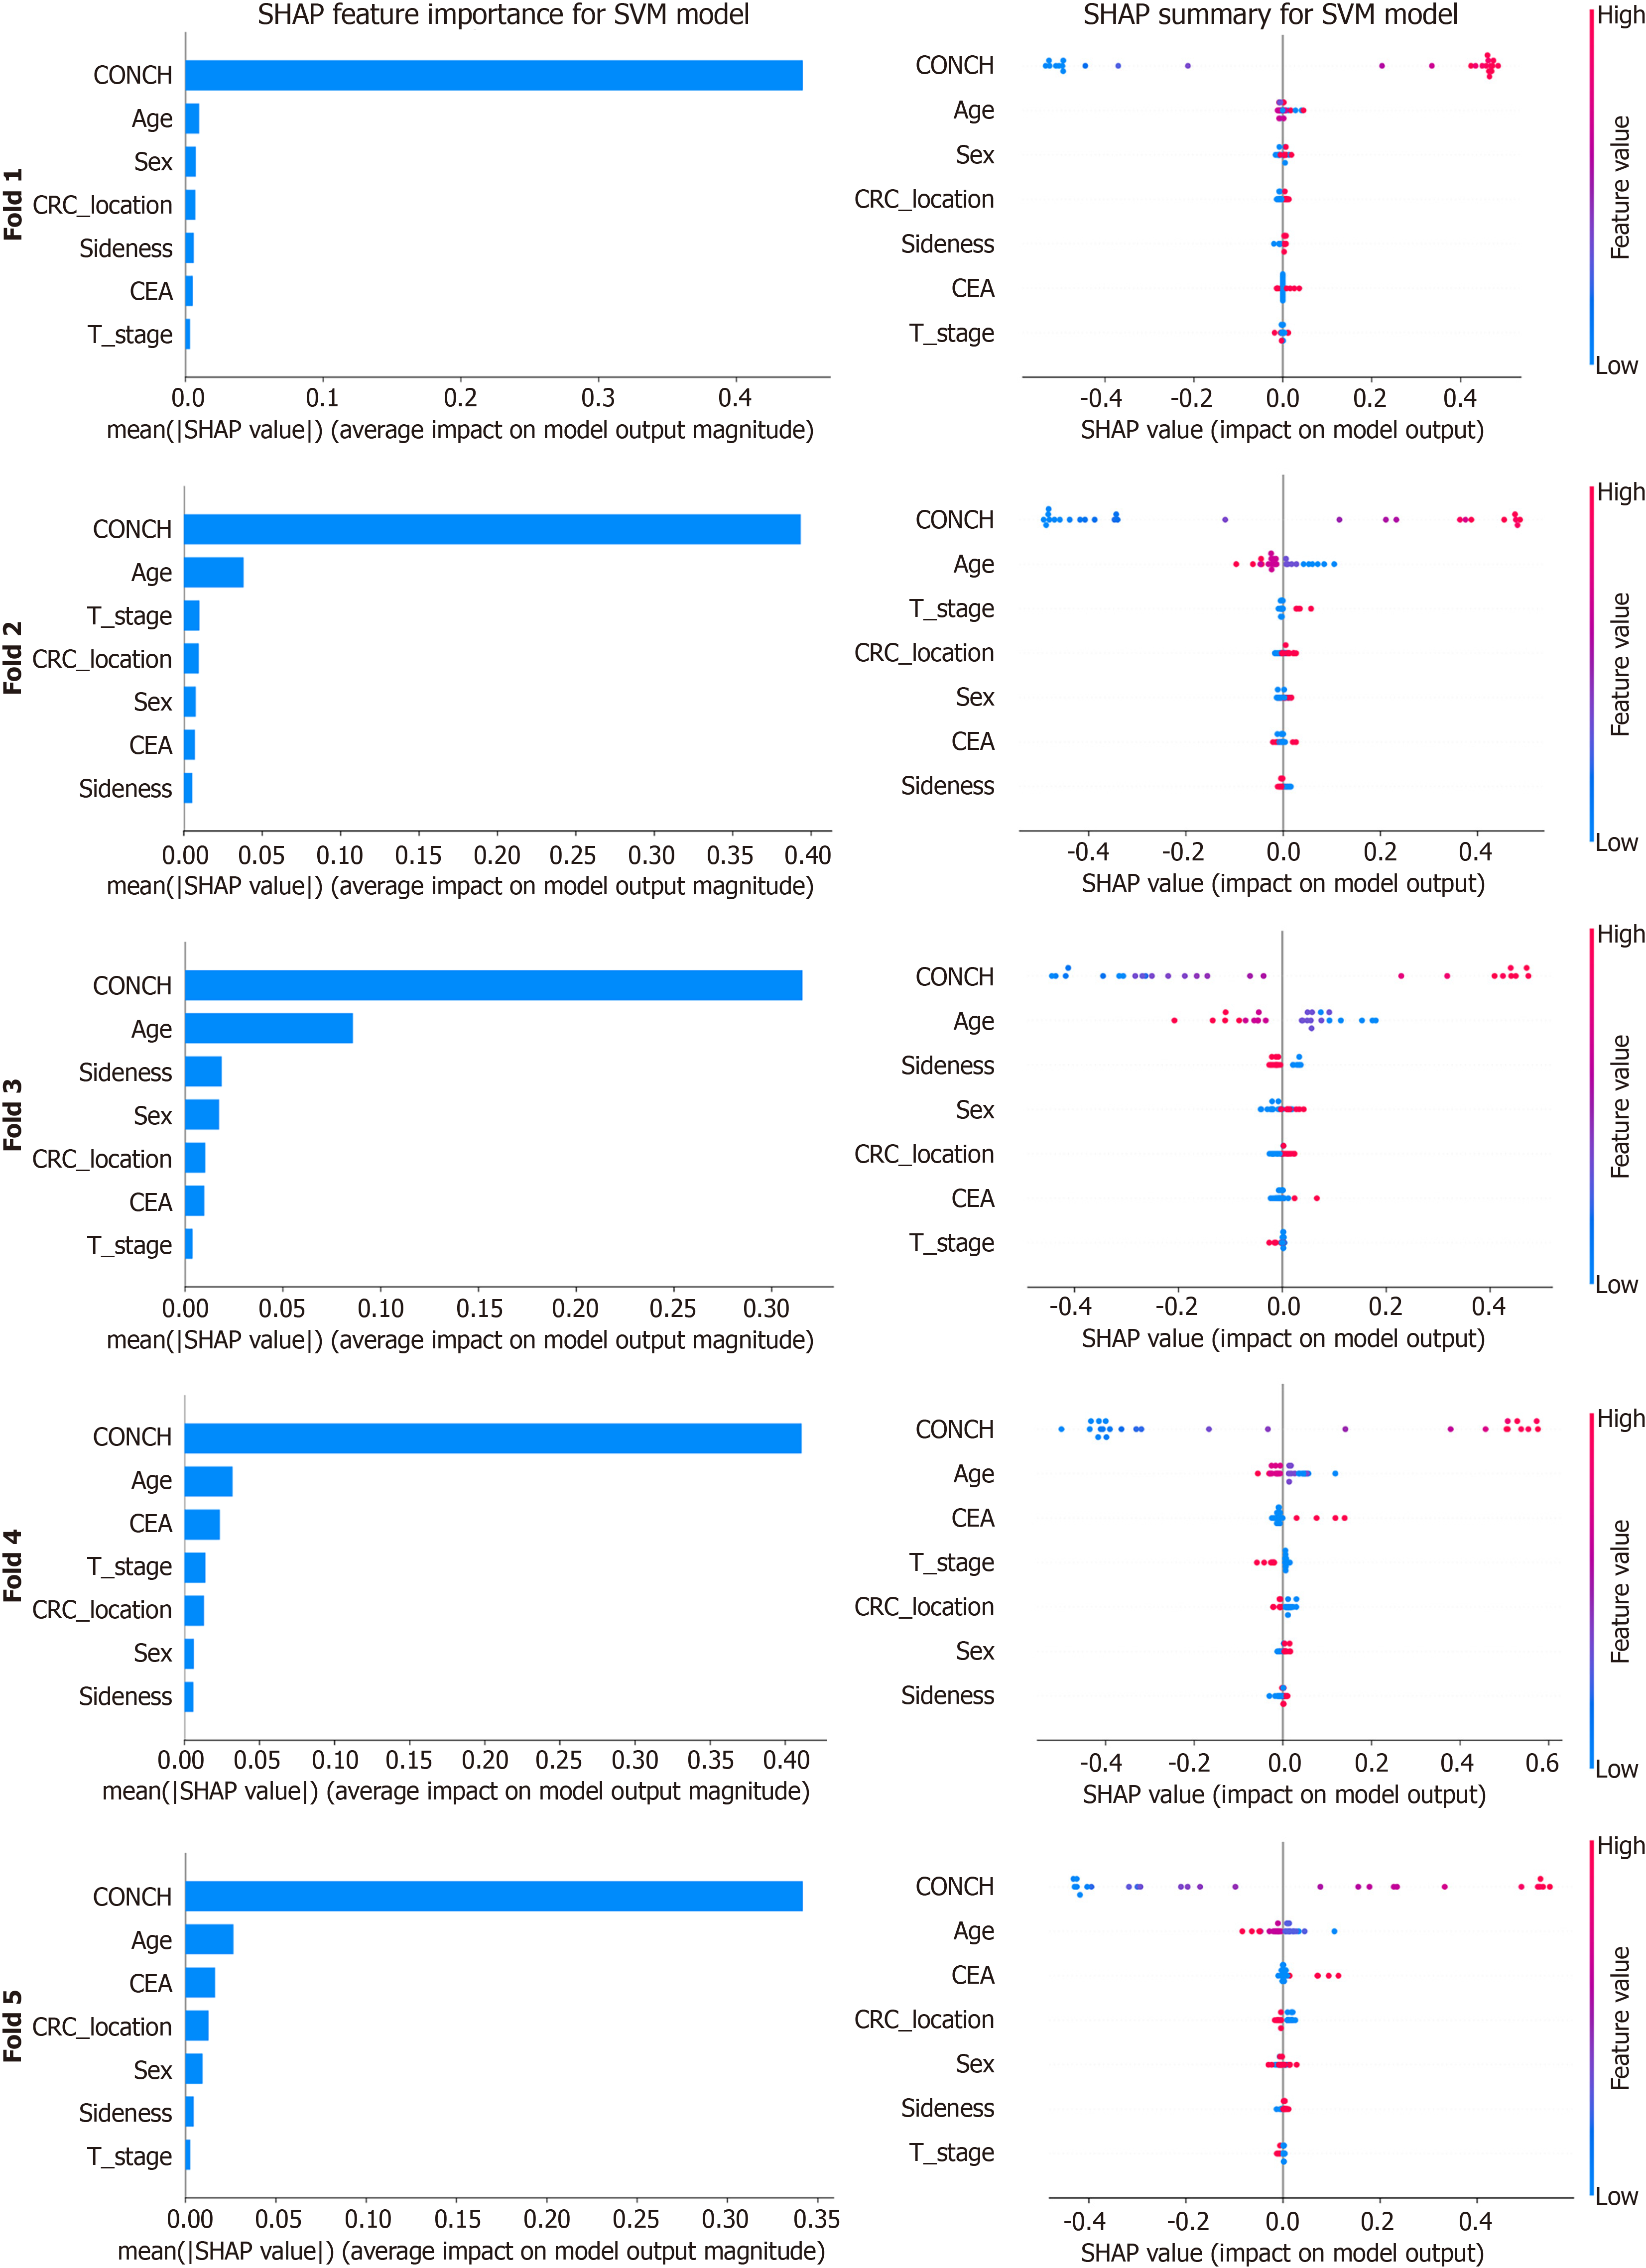
Figure 5 SHapley Additive exPlanations analysis of the top-performing support vector machine model.
This figure presents a SHapley Additive exPlanations (SHAP) analysis of the top-performing support vector machine model across the five cross-validation folds. For each fold, overall feature importance is ranked by mean absolute SHAP value (bar charts, left), while corresponding summary plots (right) visualize the distribution and directional impact of SHAP values for individual predictions. In these plots, color indicates the original feature value (high in red, low in blue), revealing how feature levels drive model output. SHAP: SHapley Additive exPlanations; SVM: Support vector machine; CEA: Carcinoembryonic antigen; CRC: Colorectal cancer.
- Citation: Zou LF, Wang XB, Li JW, Ouyang X, Luo YY, Luo Y, Wang CL. Predicting lymph node metastasis in colorectal cancer using case-level multiple instance learning. World J Gastroenterol 2026; 32(1): 112090
- URL: https://www.wjgnet.com/1007-9327/full/v32/i1/112090.htm
- DOI: https://dx.doi.org/10.3748/wjg.v32.i1.112090