
















©The Author(s) 2026.
World J Gastroenterol. Jan 7, 2026; 32(1): 112090
Published online Jan 7, 2026. doi: 10.3748/wjg.v32.i1.112090
Published online Jan 7, 2026. doi: 10.3748/wjg.v32.i1.112090
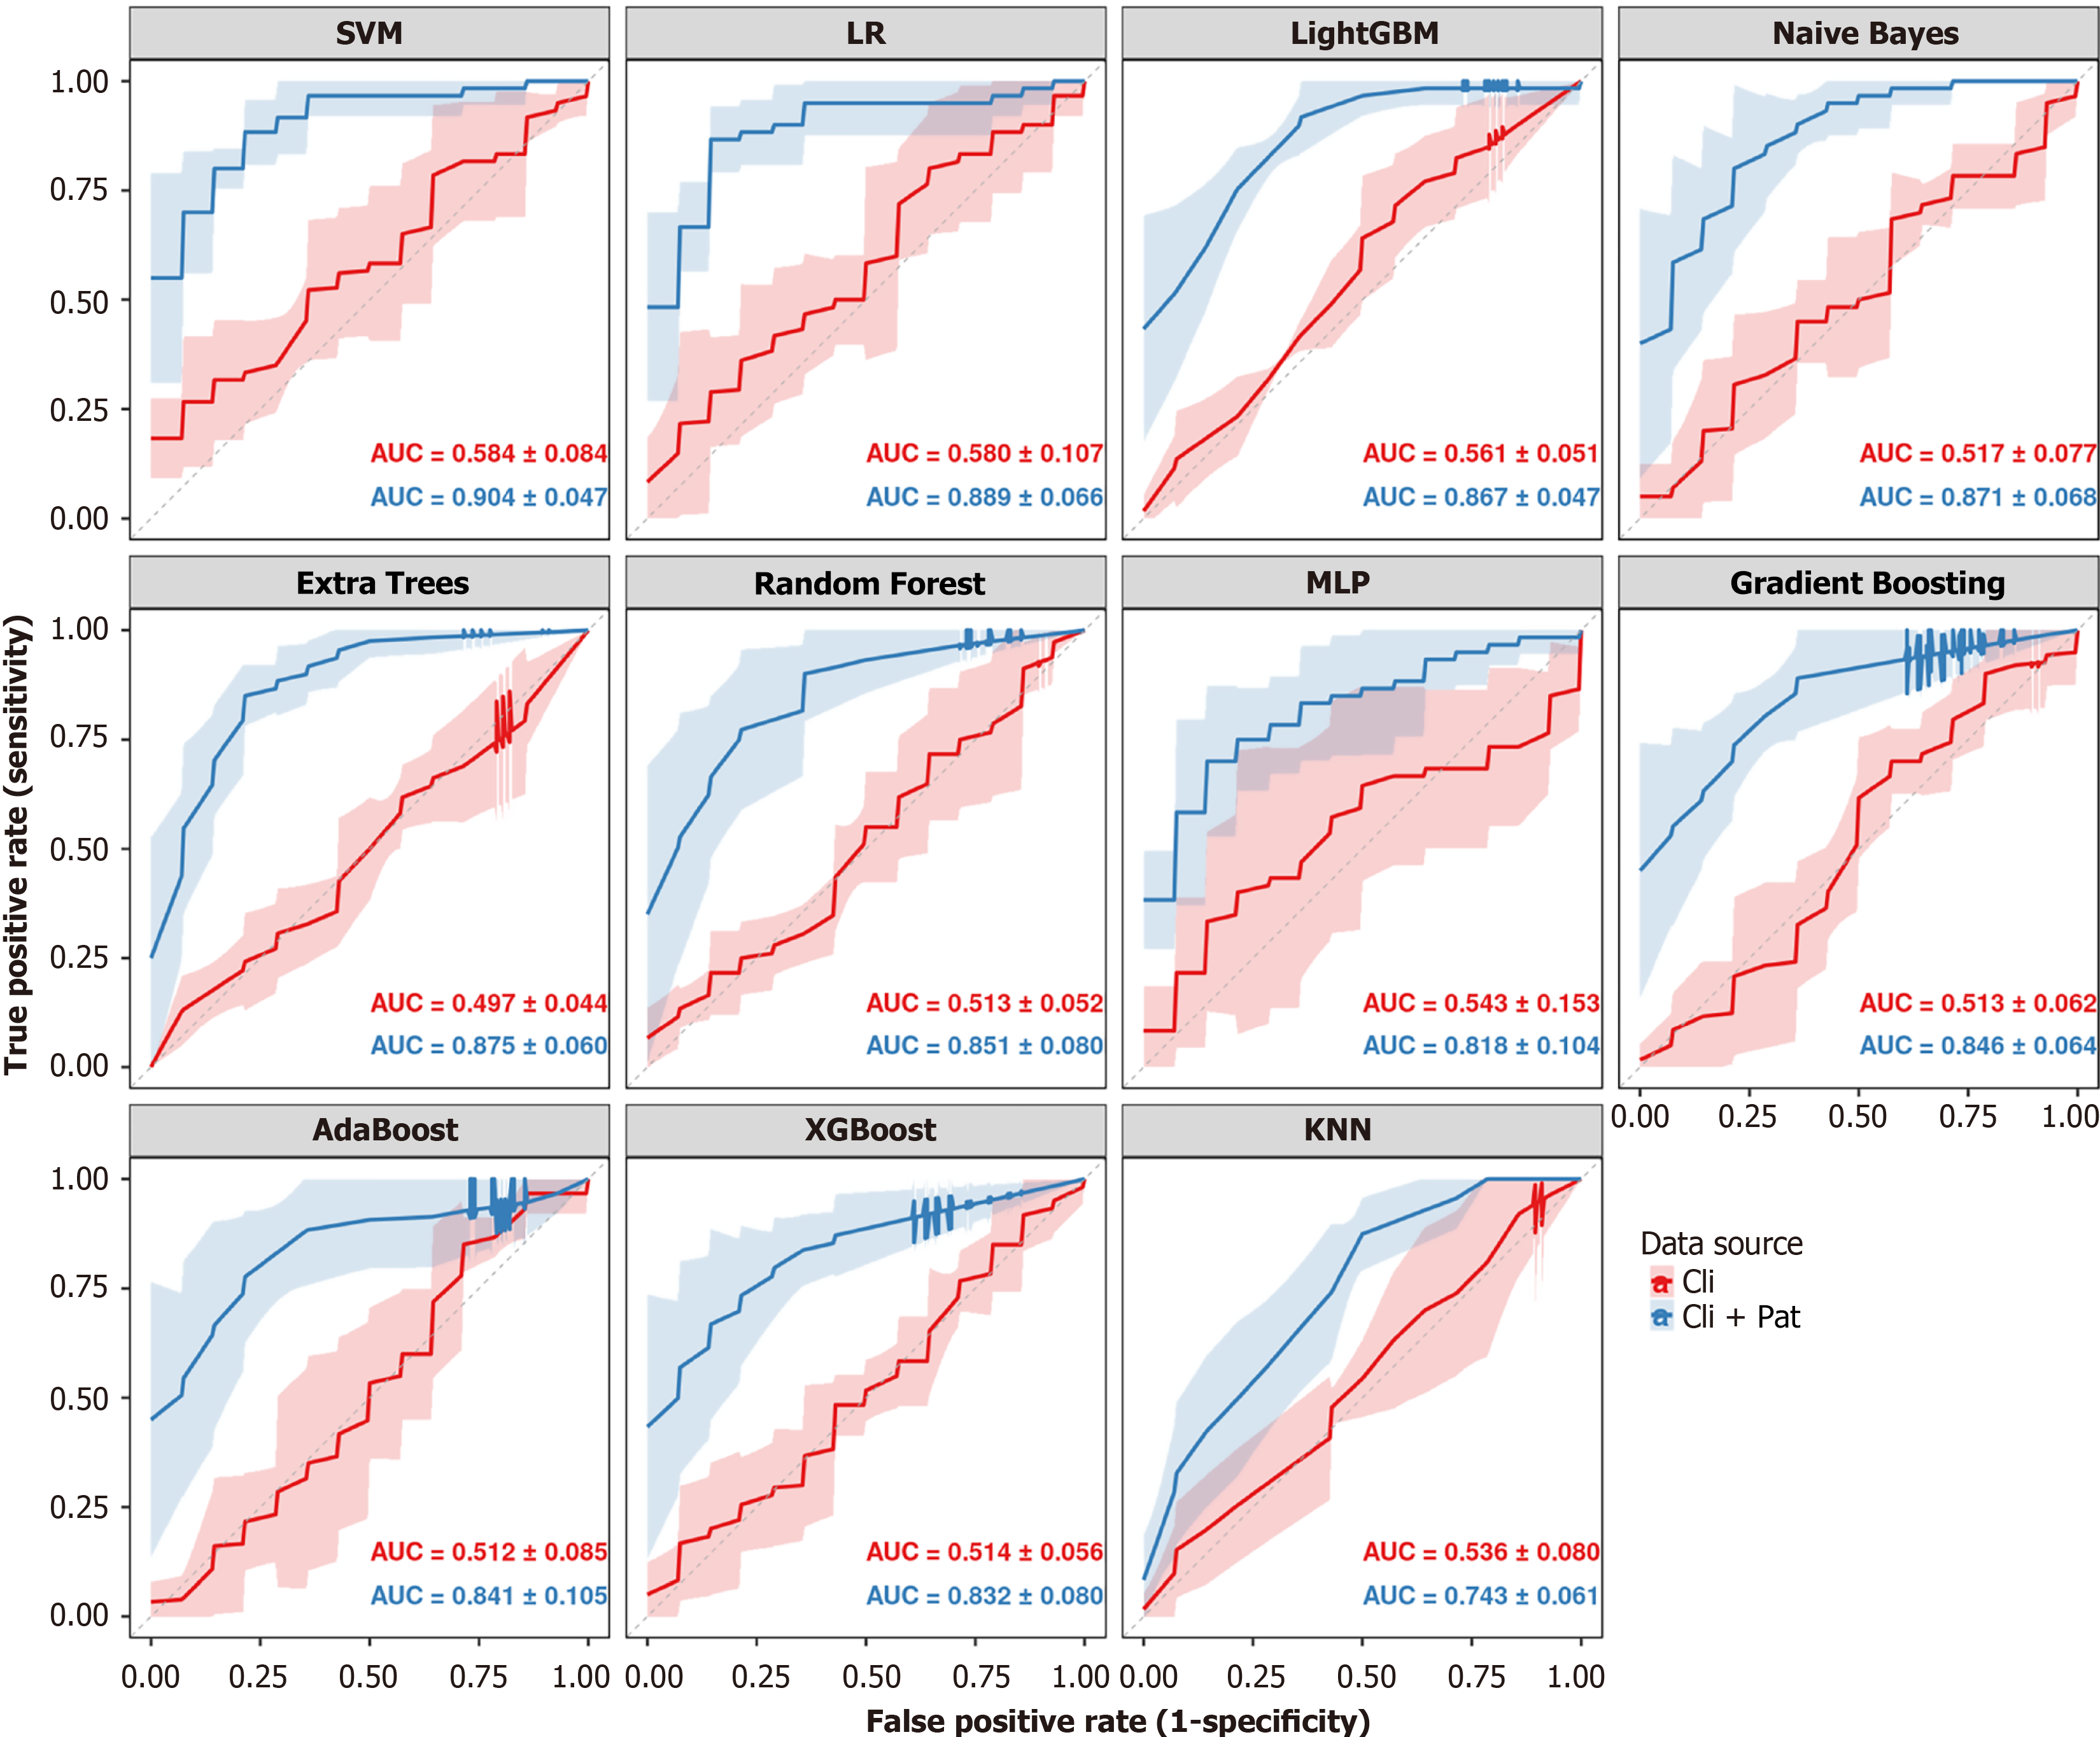
Figure 4 Comparative performance of machine learning models for predicting lymph node metastasis.
This figure presents eleven panels, each dedicated to a different machine learning classifier. Within each panel, two receiver operating characteristic (ROC) curves are displayed to compare predictive performance based on different feature sets. The red curve represents the model trained using only clinical features ('Cli'), while the blue curve represents the model trained on combined clinical and deep learning-derived pathology features ('Cli + Pat'). The solid lines depict the mean ROC curve averaged across a 5-fold cross-validation, with the shaded areas representing the standard deviation. The corresponding mean area under the curve ± SD values for each feature set are annotated within each panel. SVM: Support vector machine; LR: Logistic regression; AUC: Area under the curve; KNN: K-nearest neighbours; GBM: Gradient boosting machine; MLP: Multilayer perceptron.
- Citation: Zou LF, Wang XB, Li JW, Ouyang X, Luo YY, Luo Y, Wang CL. Predicting lymph node metastasis in colorectal cancer using case-level multiple instance learning. World J Gastroenterol 2026; 32(1): 112090
- URL: https://www.wjgnet.com/1007-9327/full/v32/i1/112090.htm
- DOI: https://dx.doi.org/10.3748/wjg.v32.i1.112090