
















©The Author(s) 2026.
World J Gastroenterol. Jan 7, 2026; 32(1): 112090
Published online Jan 7, 2026. doi: 10.3748/wjg.v32.i1.112090
Published online Jan 7, 2026. doi: 10.3748/wjg.v32.i1.112090
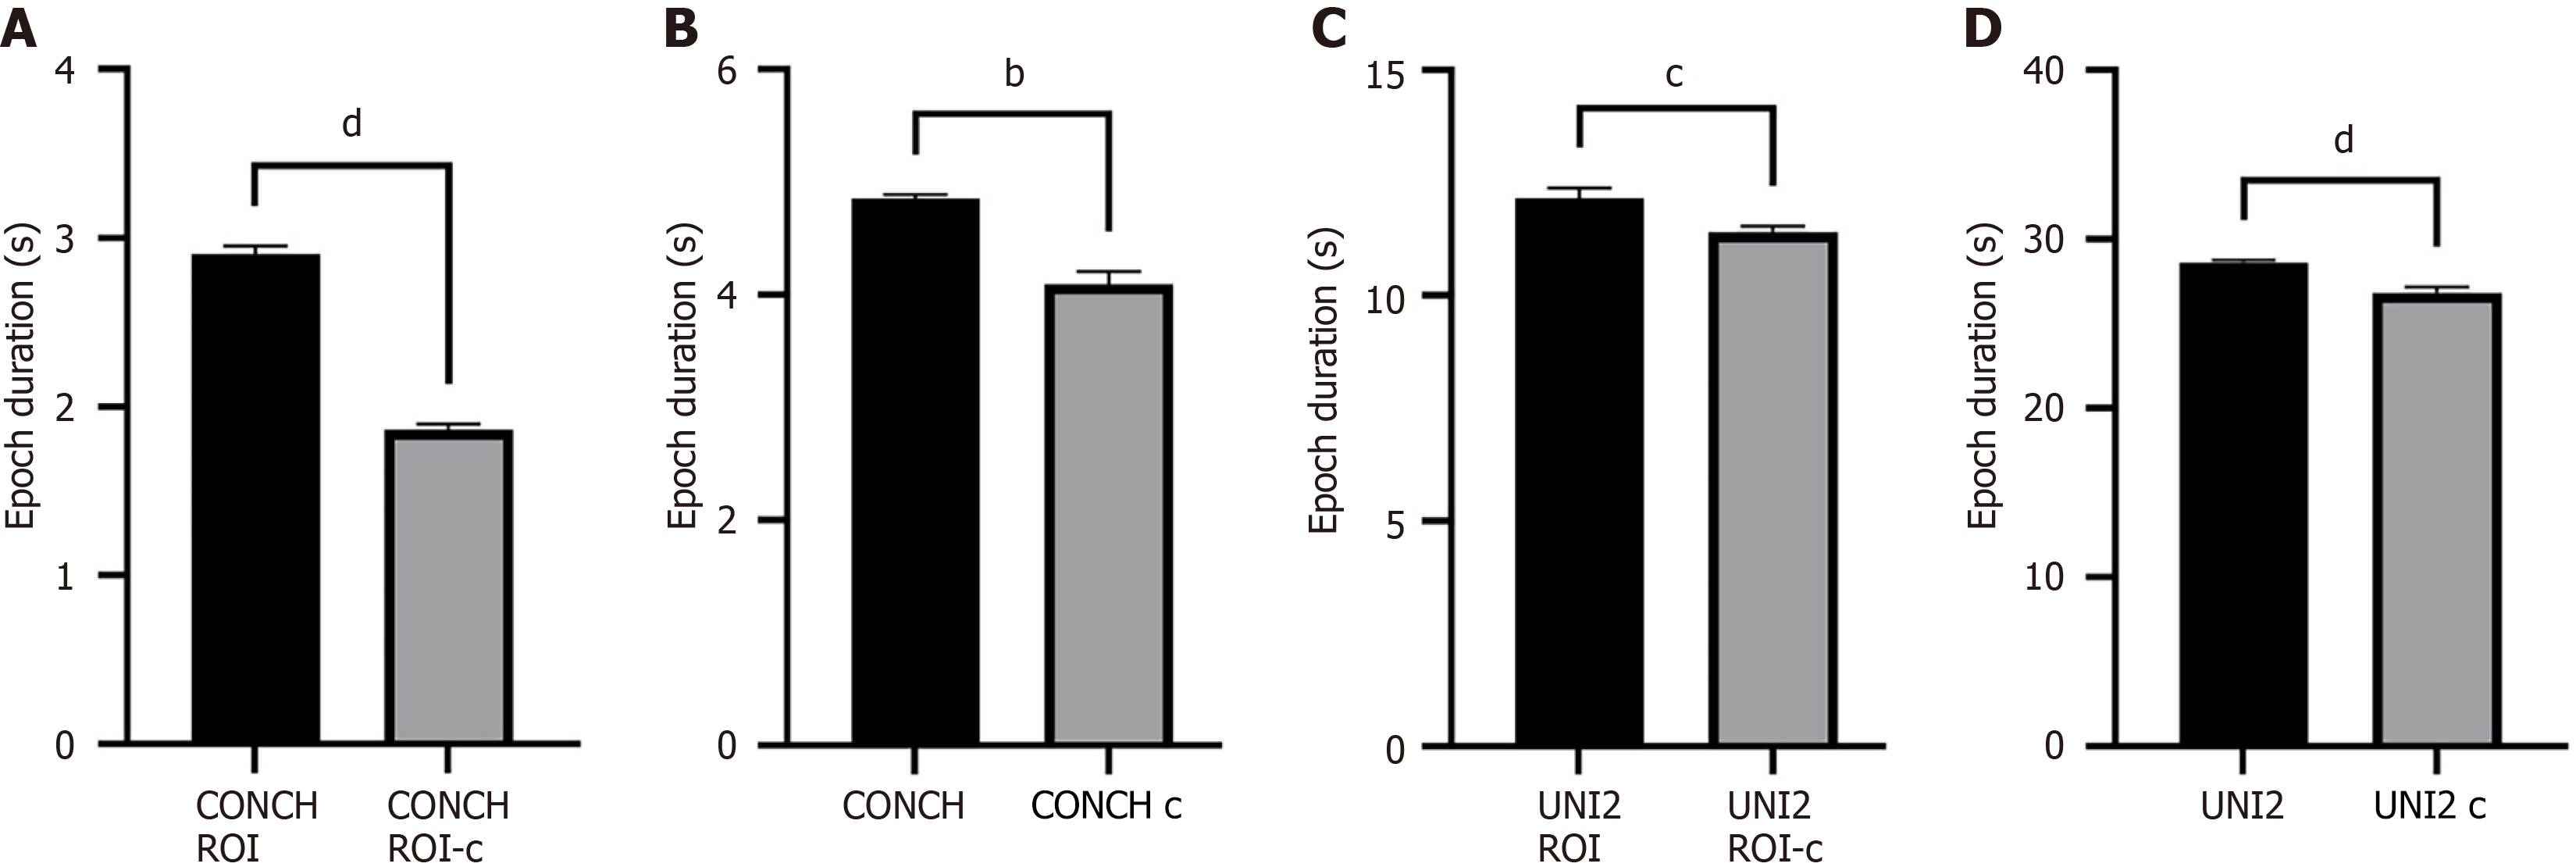
Figure 3 Comparison of computational efficiency across different model configurations.
A: CONCH v1.5 model with pathologist-annotated regions of interest (ROI); B: CONCH v1.5 model without ROI annotations; C: UNI2-h model with ROI annotations; D: UNI2-h model without ROI annotations. Each panel displays the mean epoch duration (in seconds), comparing slide-level (black bars) and case-level (gray bars) training strategies. Data are presented as mean ± SD. Statistical significance was determined using a two-tailed unpaired t-test (A, C, D) or a Mann-Whitney U test (B). bP < 0.01, cP < 0.001, dP < 0.0001. ROI: Regions of interest.
- Citation: Zou LF, Wang XB, Li JW, Ouyang X, Luo YY, Luo Y, Wang CL. Predicting lymph node metastasis in colorectal cancer using case-level multiple instance learning. World J Gastroenterol 2026; 32(1): 112090
- URL: https://www.wjgnet.com/1007-9327/full/v32/i1/112090.htm
- DOI: https://dx.doi.org/10.3748/wjg.v32.i1.112090