
















©The Author(s) 2025.
World J Gastroenterol. Dec 28, 2025; 31(48): 112972
Published online Dec 28, 2025. doi: 10.3748/wjg.v31.i48.112972
Published online Dec 28, 2025. doi: 10.3748/wjg.v31.i48.112972
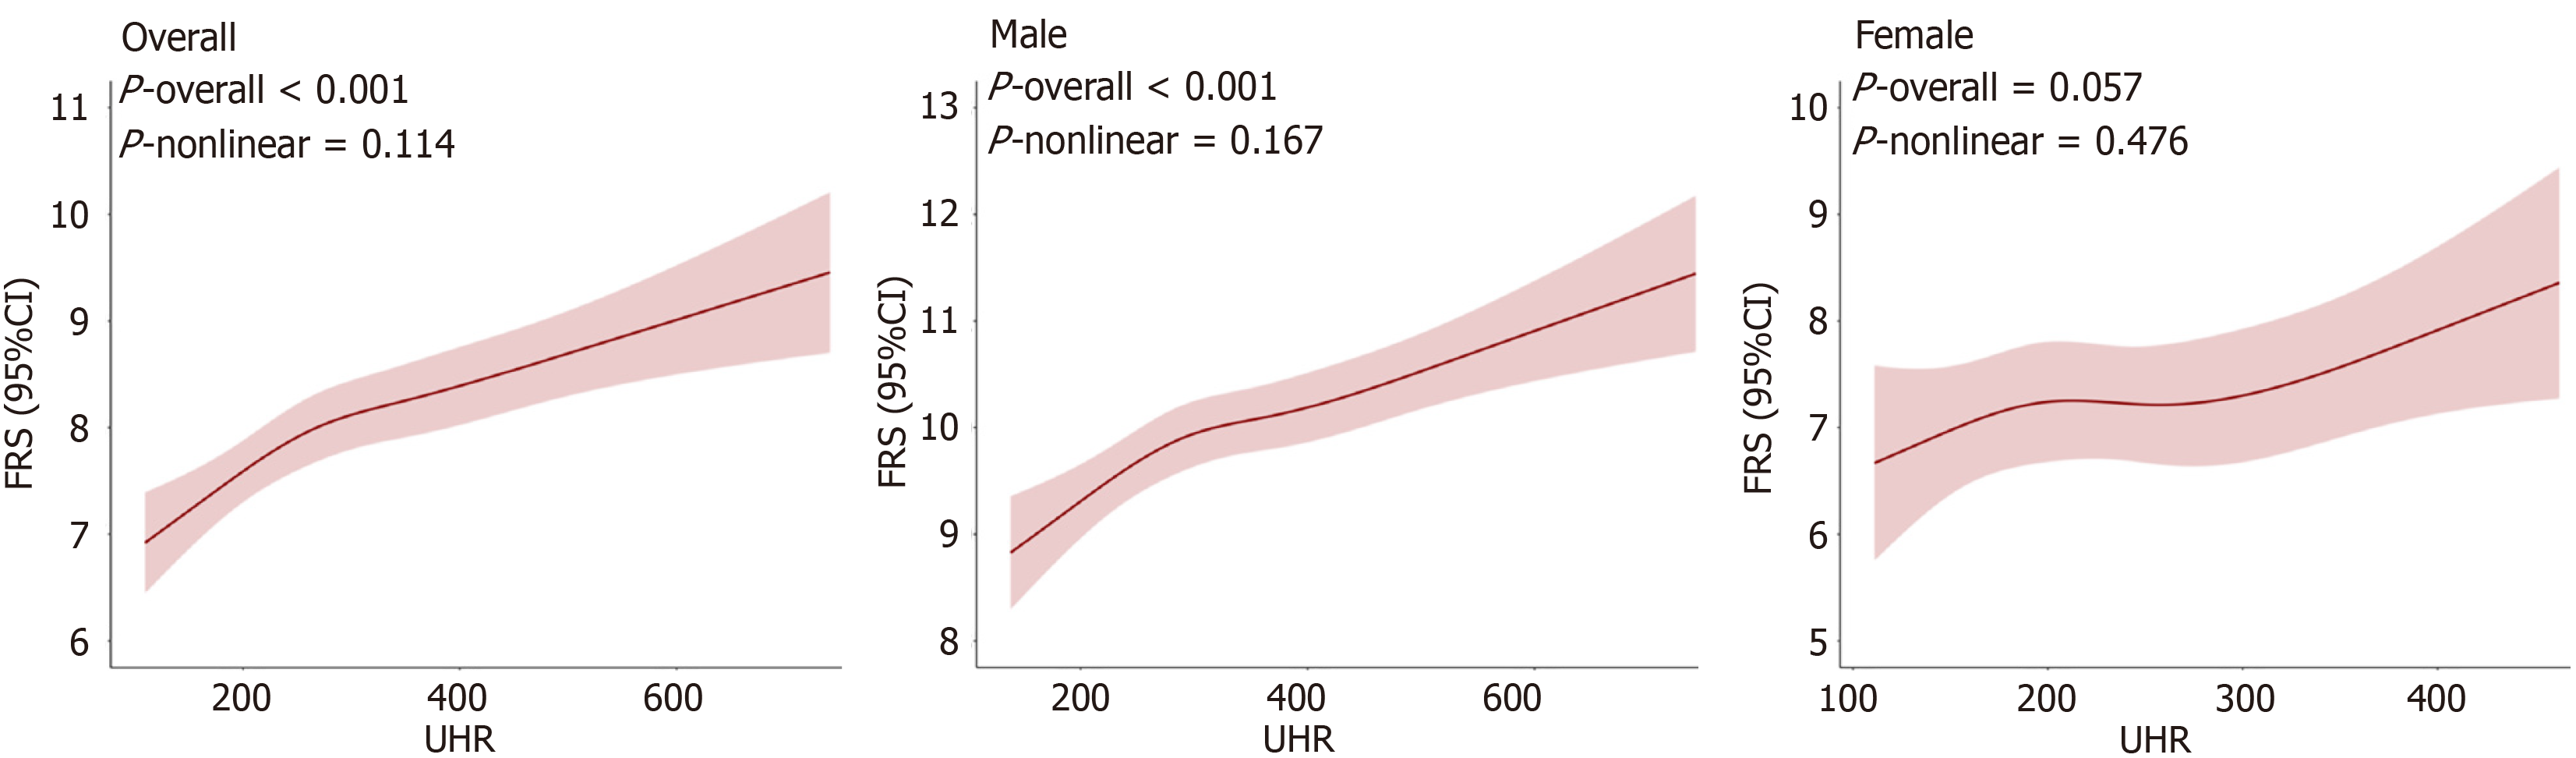
Figure 3 Adjusted dose-response curve of uric acid-to-high-density lipoprotein cholesterol ratio on predicted Framingham risk score in the overall population, males, and females.
The red line represents the curve fitting between the independent variable and the dependent variable, and the red area indicates the 95% confidence interval. Adjusted factors include sex, age, smoking, hypertension, central obesity, hyperlipidemia, body mass index, diabetes, metabolic syndrome, and metabolic dysfunction-associated steatotic liver disease. UHR: Uric acid-to-high-density lipoprotein cholesterol ratio; FRS: Framingham risk score; CI: Confidence interval.
- Citation: Wang Y, Ma GH, Qu MY, Xu QS, Huang HX. Serum uric acid-to-high-density lipoprotein cholesterol ratio and cardiovascular risk in Asian patients with metabolic dysfunction-associated steatotic liver disease. World J Gastroenterol 2025; 31(48): 112972
- URL: https://www.wjgnet.com/1007-9327/full/v31/i48/112972.htm
- DOI: https://dx.doi.org/10.3748/wjg.v31.i48.112972