
















©The Author(s) 2025.
World J Gastroenterol. Dec 28, 2025; 31(48): 112972
Published online Dec 28, 2025. doi: 10.3748/wjg.v31.i48.112972
Published online Dec 28, 2025. doi: 10.3748/wjg.v31.i48.112972
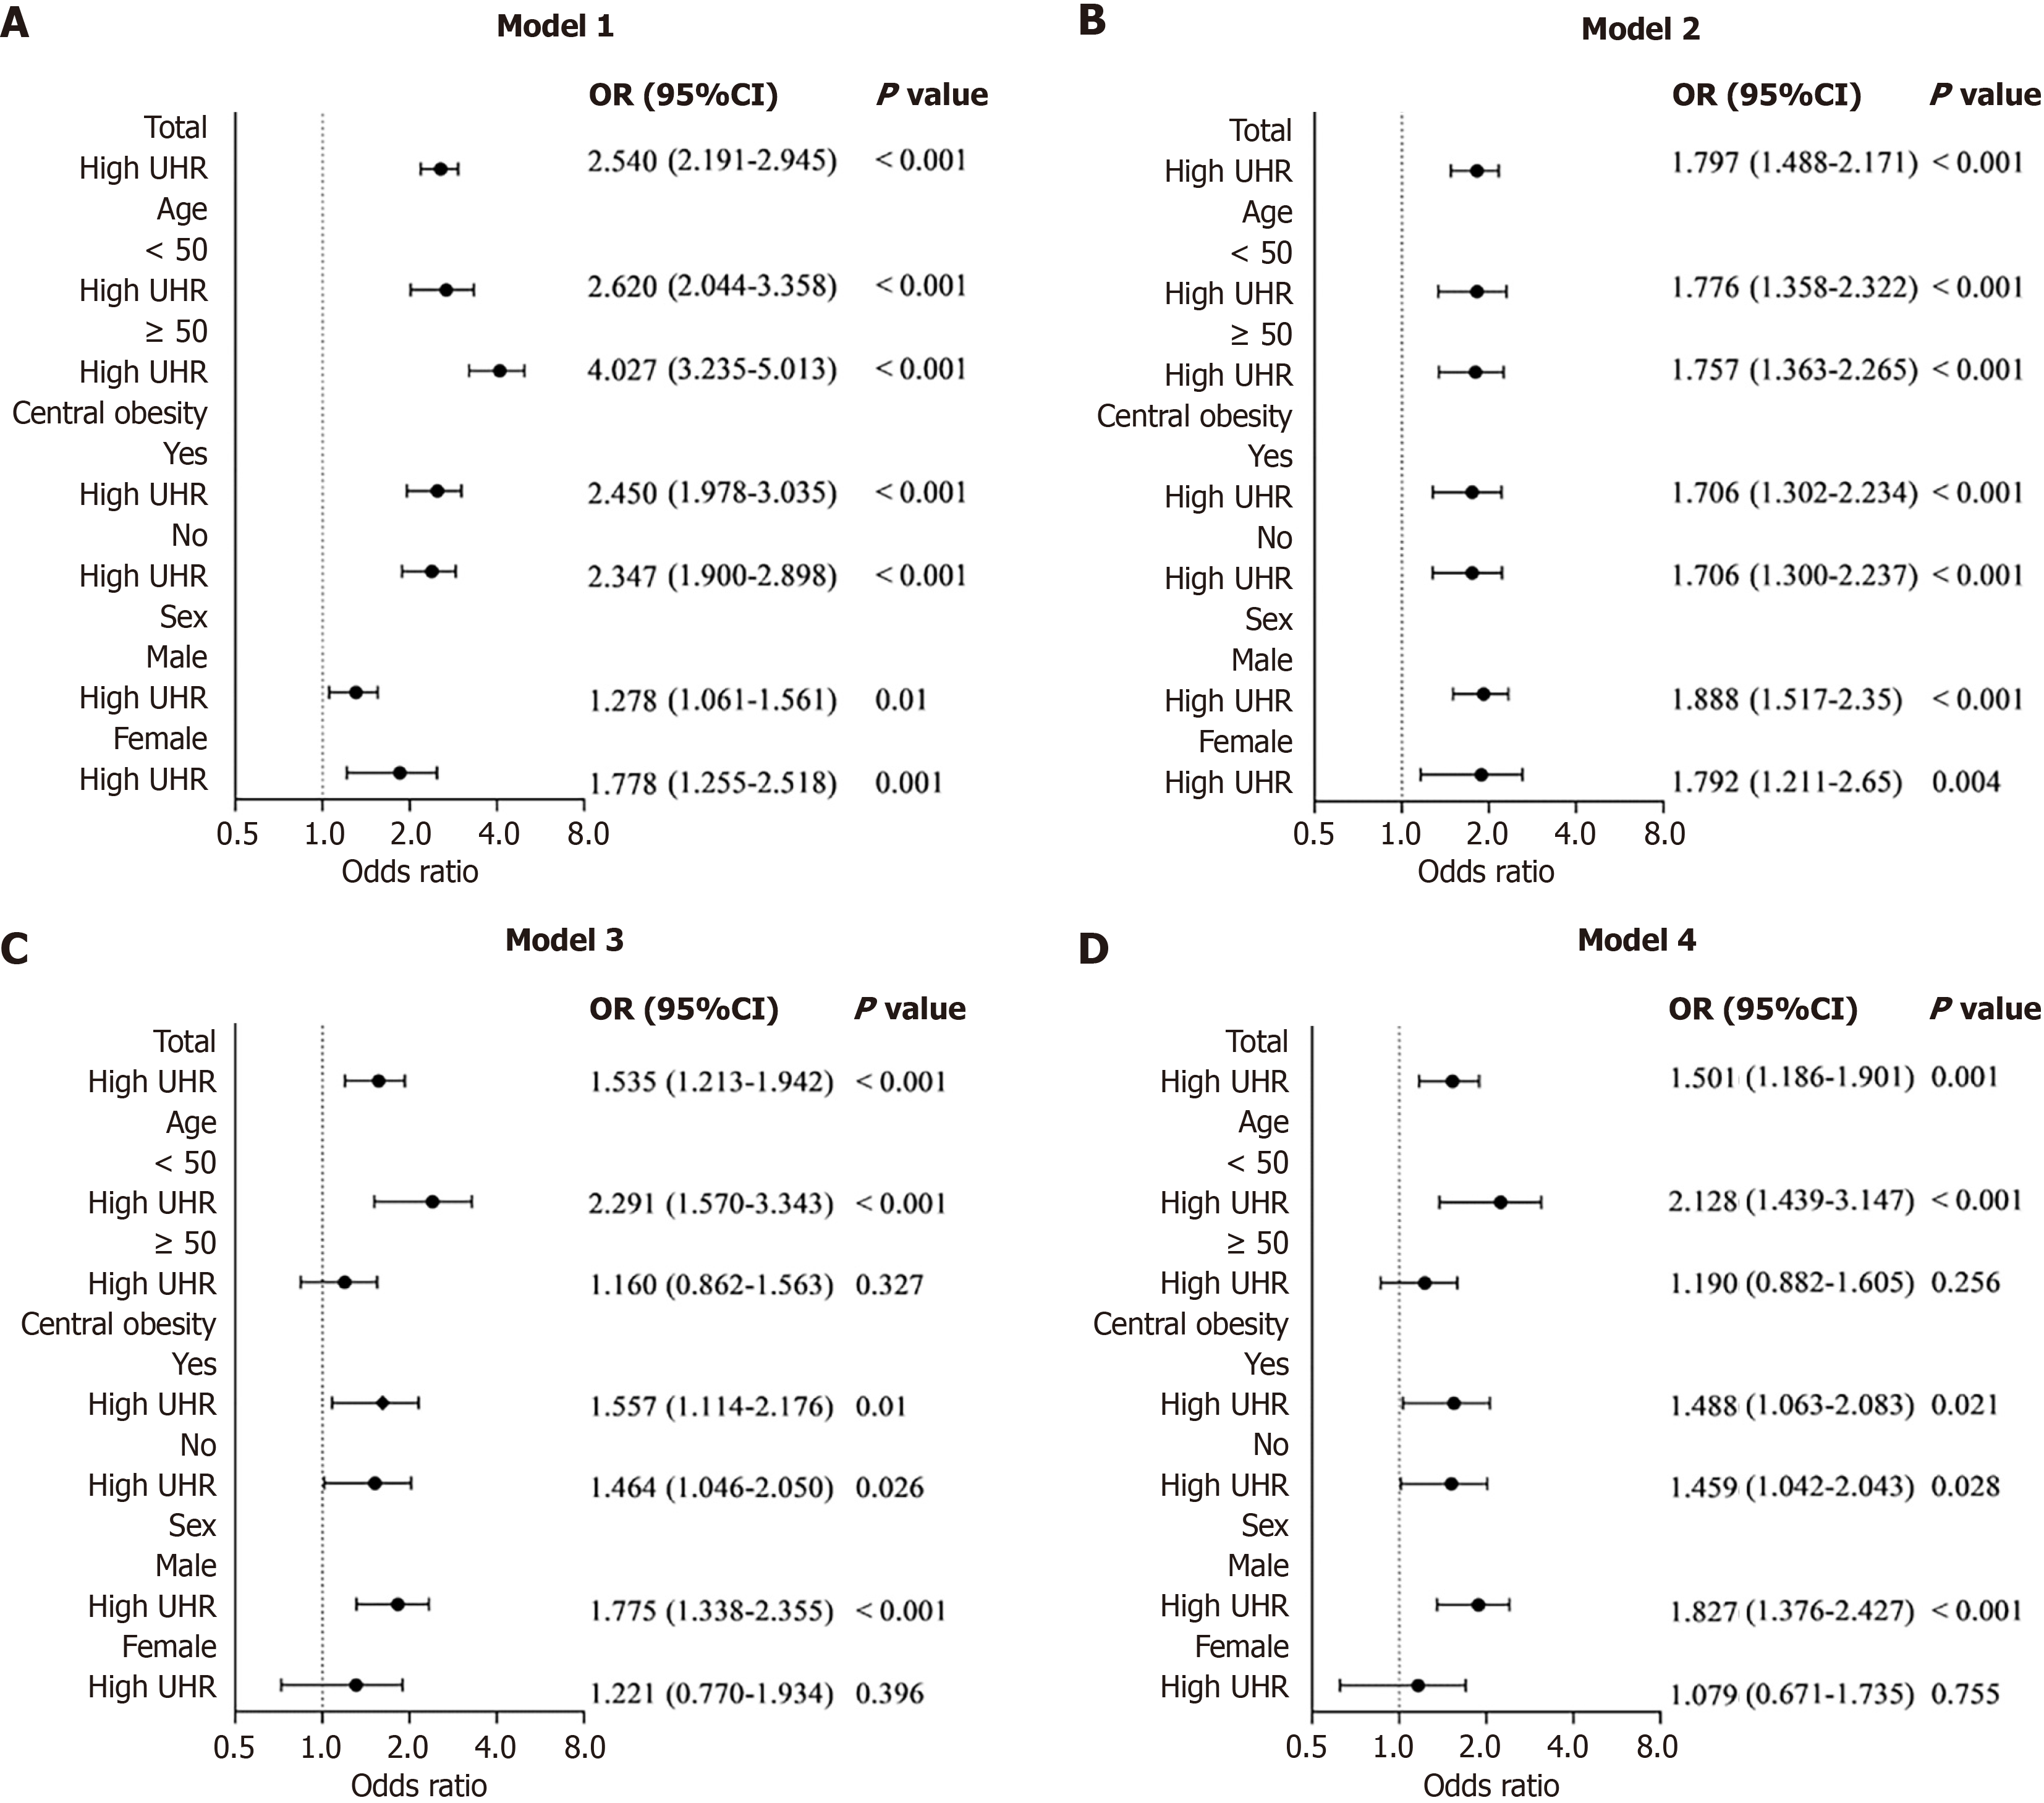
Figure 2 The forest plot depicts the association between high uric acid-to-high-density lipoprotein cholesterol ratio and high-risk Framingham risk score in the general population, along with subgroup analyses stratified by age, central obesity, and sex.
It shows the adjusted odds ratios for this association after controlling for multiple covariates. UHR: Uric acid-to-high-density lipoprotein cholesterol ratio; OR: Odds ratio; CI: Confidence interval.
- Citation: Wang Y, Ma GH, Qu MY, Xu QS, Huang HX. Serum uric acid-to-high-density lipoprotein cholesterol ratio and cardiovascular risk in Asian patients with metabolic dysfunction-associated steatotic liver disease. World J Gastroenterol 2025; 31(48): 112972
- URL: https://www.wjgnet.com/1007-9327/full/v31/i48/112972.htm
- DOI: https://dx.doi.org/10.3748/wjg.v31.i48.112972