
















©The Author(s) 2025.
World J Gastroenterol. Dec 28, 2025; 31(48): 112653
Published online Dec 28, 2025. doi: 10.3748/wjg.v31.i48.112653
Published online Dec 28, 2025. doi: 10.3748/wjg.v31.i48.112653
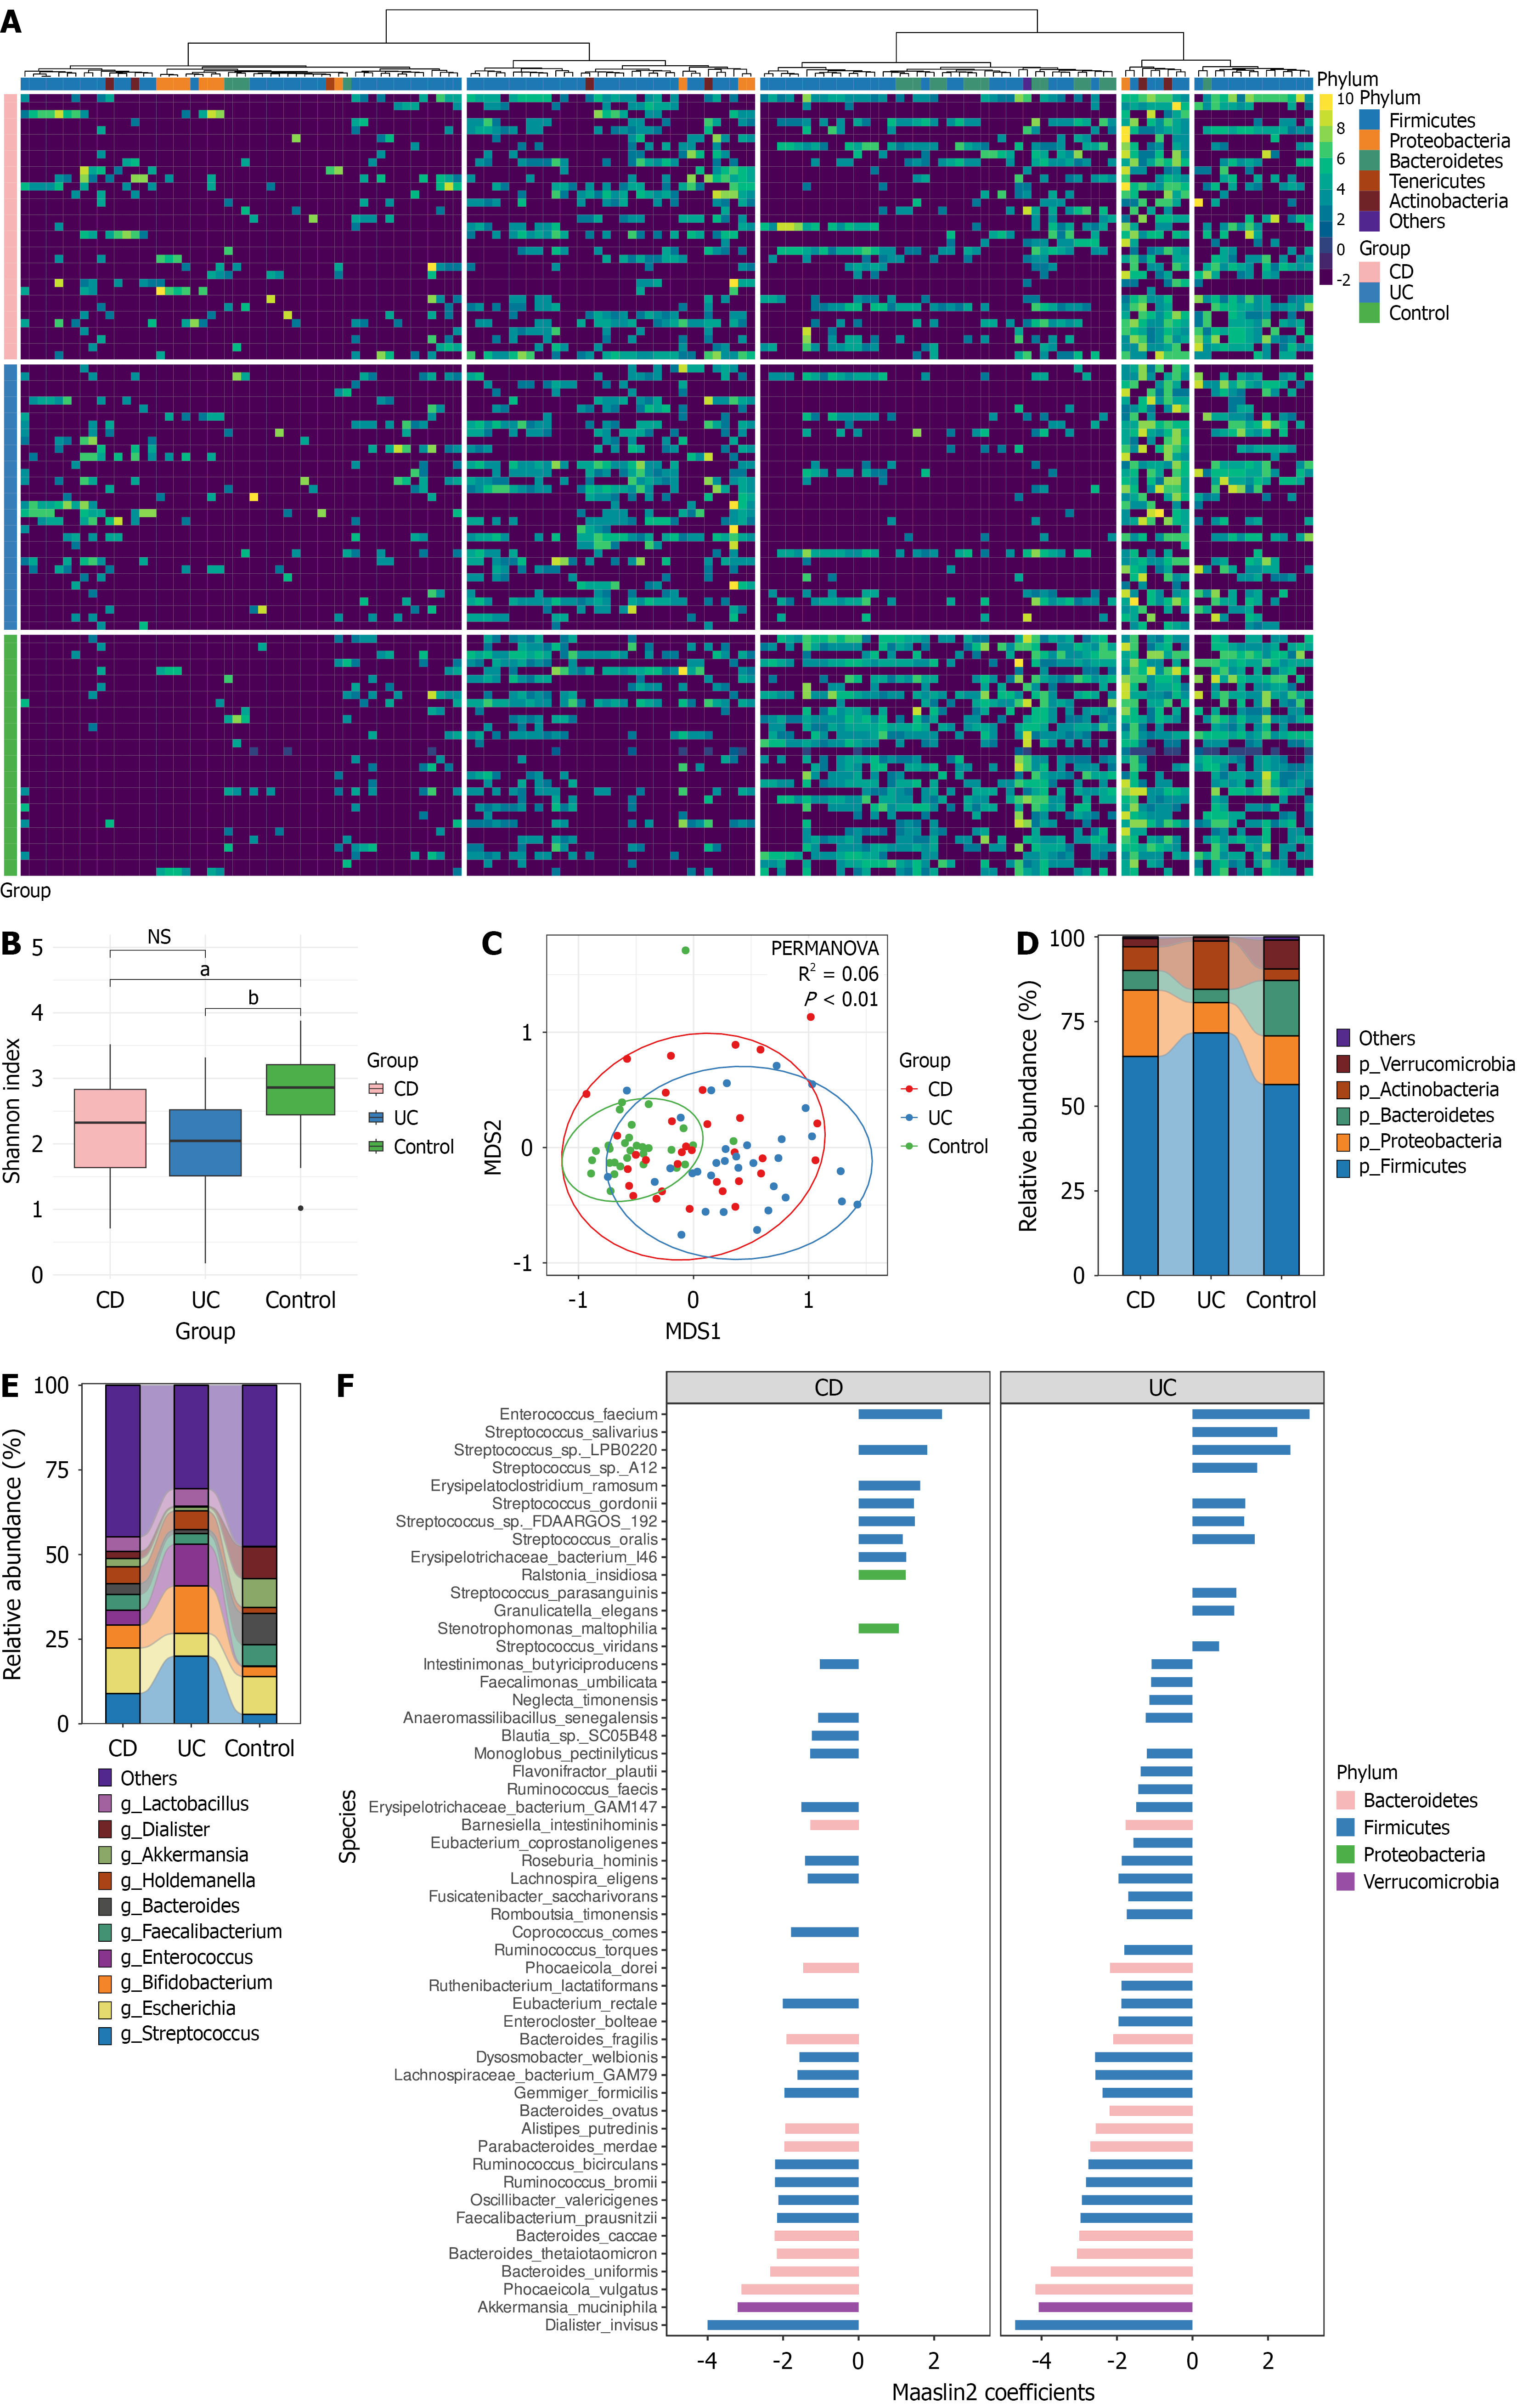
Figure 6 Results of exploratory analysis of gut microbiota diversity in experimental groups (ulcerative colitis and Crohn’s disease, and control).
A: The most abundant genera in the gut microbiota of patients are presented as a heatmap. Colors denote the relative abundance of species obtained by the emu pipeline after log transformation using pseudo counts. The figure shows the top 90 by relative abundance species. The rows correspond to the samples/patients; the phylum-level taxonomic ranks are denoted with a right color bar. Hierarchical clustering was performed using the Euclidean distance and complete linkage; B: Shannon index distribution of stool samples across experimental groups. Different colors denote different experimental groups. Horizontal brackets show the P-value obtained by comparing corresponding groups using the Wilcoxon rank-sum test; C: Non-metric multidimensional scaling biplot obtained using taxonomic profiles at the species level of patients’ and healthy controls’ stool samples. Different groups are shown by different color dots. Permutational multivariate analysis of variance analysis results are presented in the lower left corner; D: Bar plots denote the distribution of phylum abundance across experimental groups. The X-axis showed experimental groups, Y-axis showed relative abundance. Different colors show different phyla; E: Bar plots denoted the distribution of genus abundance across experimental groups. The X-axis showed experimental groups, Y-axis showed relative abundance. Different colors show different genera. F: Results of identifying differentially abundant species between ulcerative colitis and coronavirus disease 2019 patient groups using Maalsin2 with the following thresholds: Minimum abundance = 0.01, minimum prevalence = 0.25, maximum significance = 0.05. The Y-axis shows microbial species, the X-axis - the Maaslin2 regression coefficient. Color indicates taxonomic affiliation at the order level for each identified species. aP > 0.05, obtained by comparison corresponded groups using the Wilcoxon rank-sum test. bP > 0.01, obtained by comparison corresponded groups using the Wilcoxon rank-sum test. UC: Ulcerative colitis; CD: Crohn’s disease; PERMANOVA: Permutational Multivariate Analysis of Variance; MDS: Multidimensional scaling ordinate; NS: Not significant.
- Citation: Zakharzhevskaya NB, Erdes SI, Belousova EA, Samolygo IS, Manina MA, Kondrashova PV, Lomakina EY, Kardonsky DA, Vorobyeva EA, Shagaleeva OY, Silantyev AA, Kazakova VD, Kashatnikova DA, Kalachnuk TN, Kolesnikova IV, Chaplin AV, Markelova MI, Grigoryeva TV, Olekhnovich EI, Veselovsky VA, Morozov MD, Zoruk PY, Boldyreva DI, Vanyushkina AA, Efimov BA. Combined metabolomic and metagenomic analysis reveals inflammatory bowel disease diversity in pediatric and adult patients. World J Gastroenterol 2025; 31(48): 112653
- URL: https://www.wjgnet.com/1007-9327/full/v31/i48/112653.htm
- DOI: https://dx.doi.org/10.3748/wjg.v31.i48.112653