
















©The Author(s) 2025.
World J Gastroenterol. Dec 21, 2025; 31(47): 114651
Published online Dec 21, 2025. doi: 10.3748/wjg.v31.i47.114651
Published online Dec 21, 2025. doi: 10.3748/wjg.v31.i47.114651
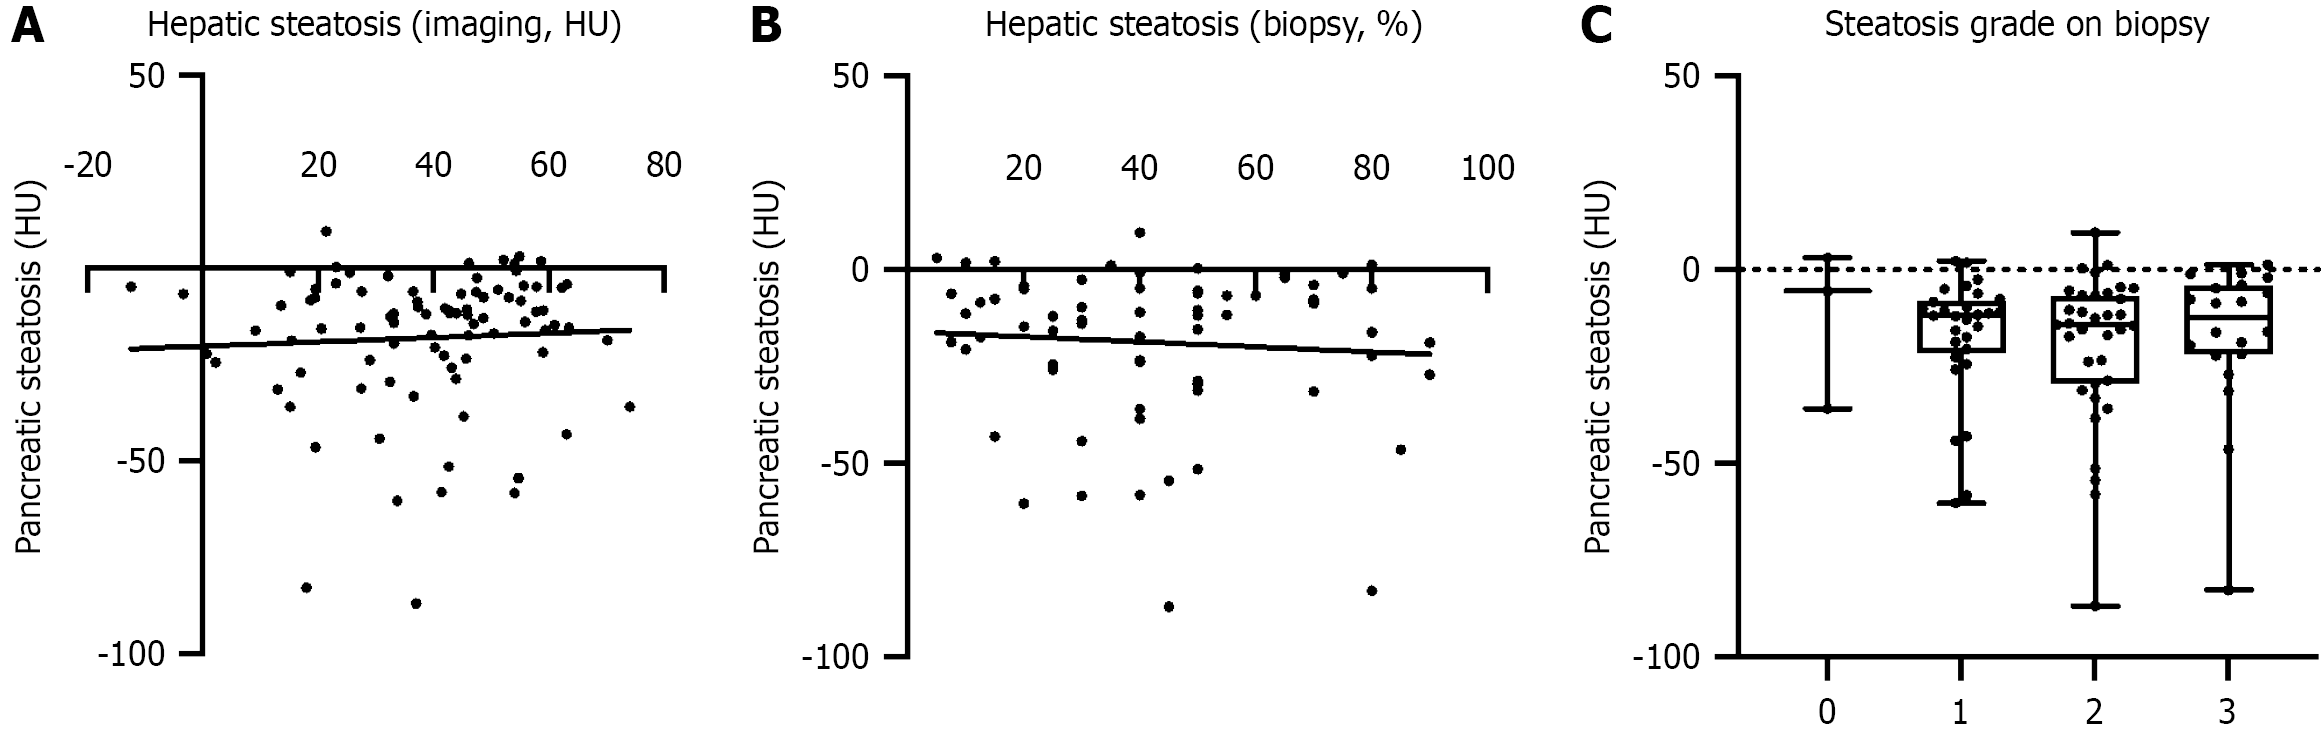
Figure 4 Relationship between pancreatic and hepatic steatosis after exclusion of patients with ‘burnt-out steatohepatitis’.
A: Scatterplot for pancreatic steatosis by hepatic steatosis on computed tomography (n = 87), Pearson correlation test, r = 0.05, P = 0.62; B: Scatterplot for pancreatic steatosis by percent hepatic steatosis on biopsy (n = 87), Spearman correlation test, r = -0.06, P = 0.29; C: Box and whiskers plot with all values included for pancreatic steatosis by steatosis grade on biopsy (n = 3 for grade 0, n = 29 for grade 1, n = 35 for grade 2, n = 20 for grade 3), Kruskal-Wallis test, P = 0.79.
- Citation: Heymann G, Rahman S, Kats D, Banini BA, Gaddam S, Aslanian E, Boateng S, Israel G, Muniraj T. Pancreatic steatosis is not associated with advanced steatohepatitis or fibrosis in metabolic dysfunction-associated steatotic liver disease. World J Gastroenterol 2025; 31(47): 114651
- URL: https://www.wjgnet.com/1007-9327/full/v31/i47/114651.htm
- DOI: https://dx.doi.org/10.3748/wjg.v31.i47.114651