
















©The Author(s) 2025.
World J Gastroenterol. Dec 21, 2025; 31(47): 114370
Published online Dec 21, 2025. doi: 10.3748/wjg.v31.i47.114370
Published online Dec 21, 2025. doi: 10.3748/wjg.v31.i47.114370
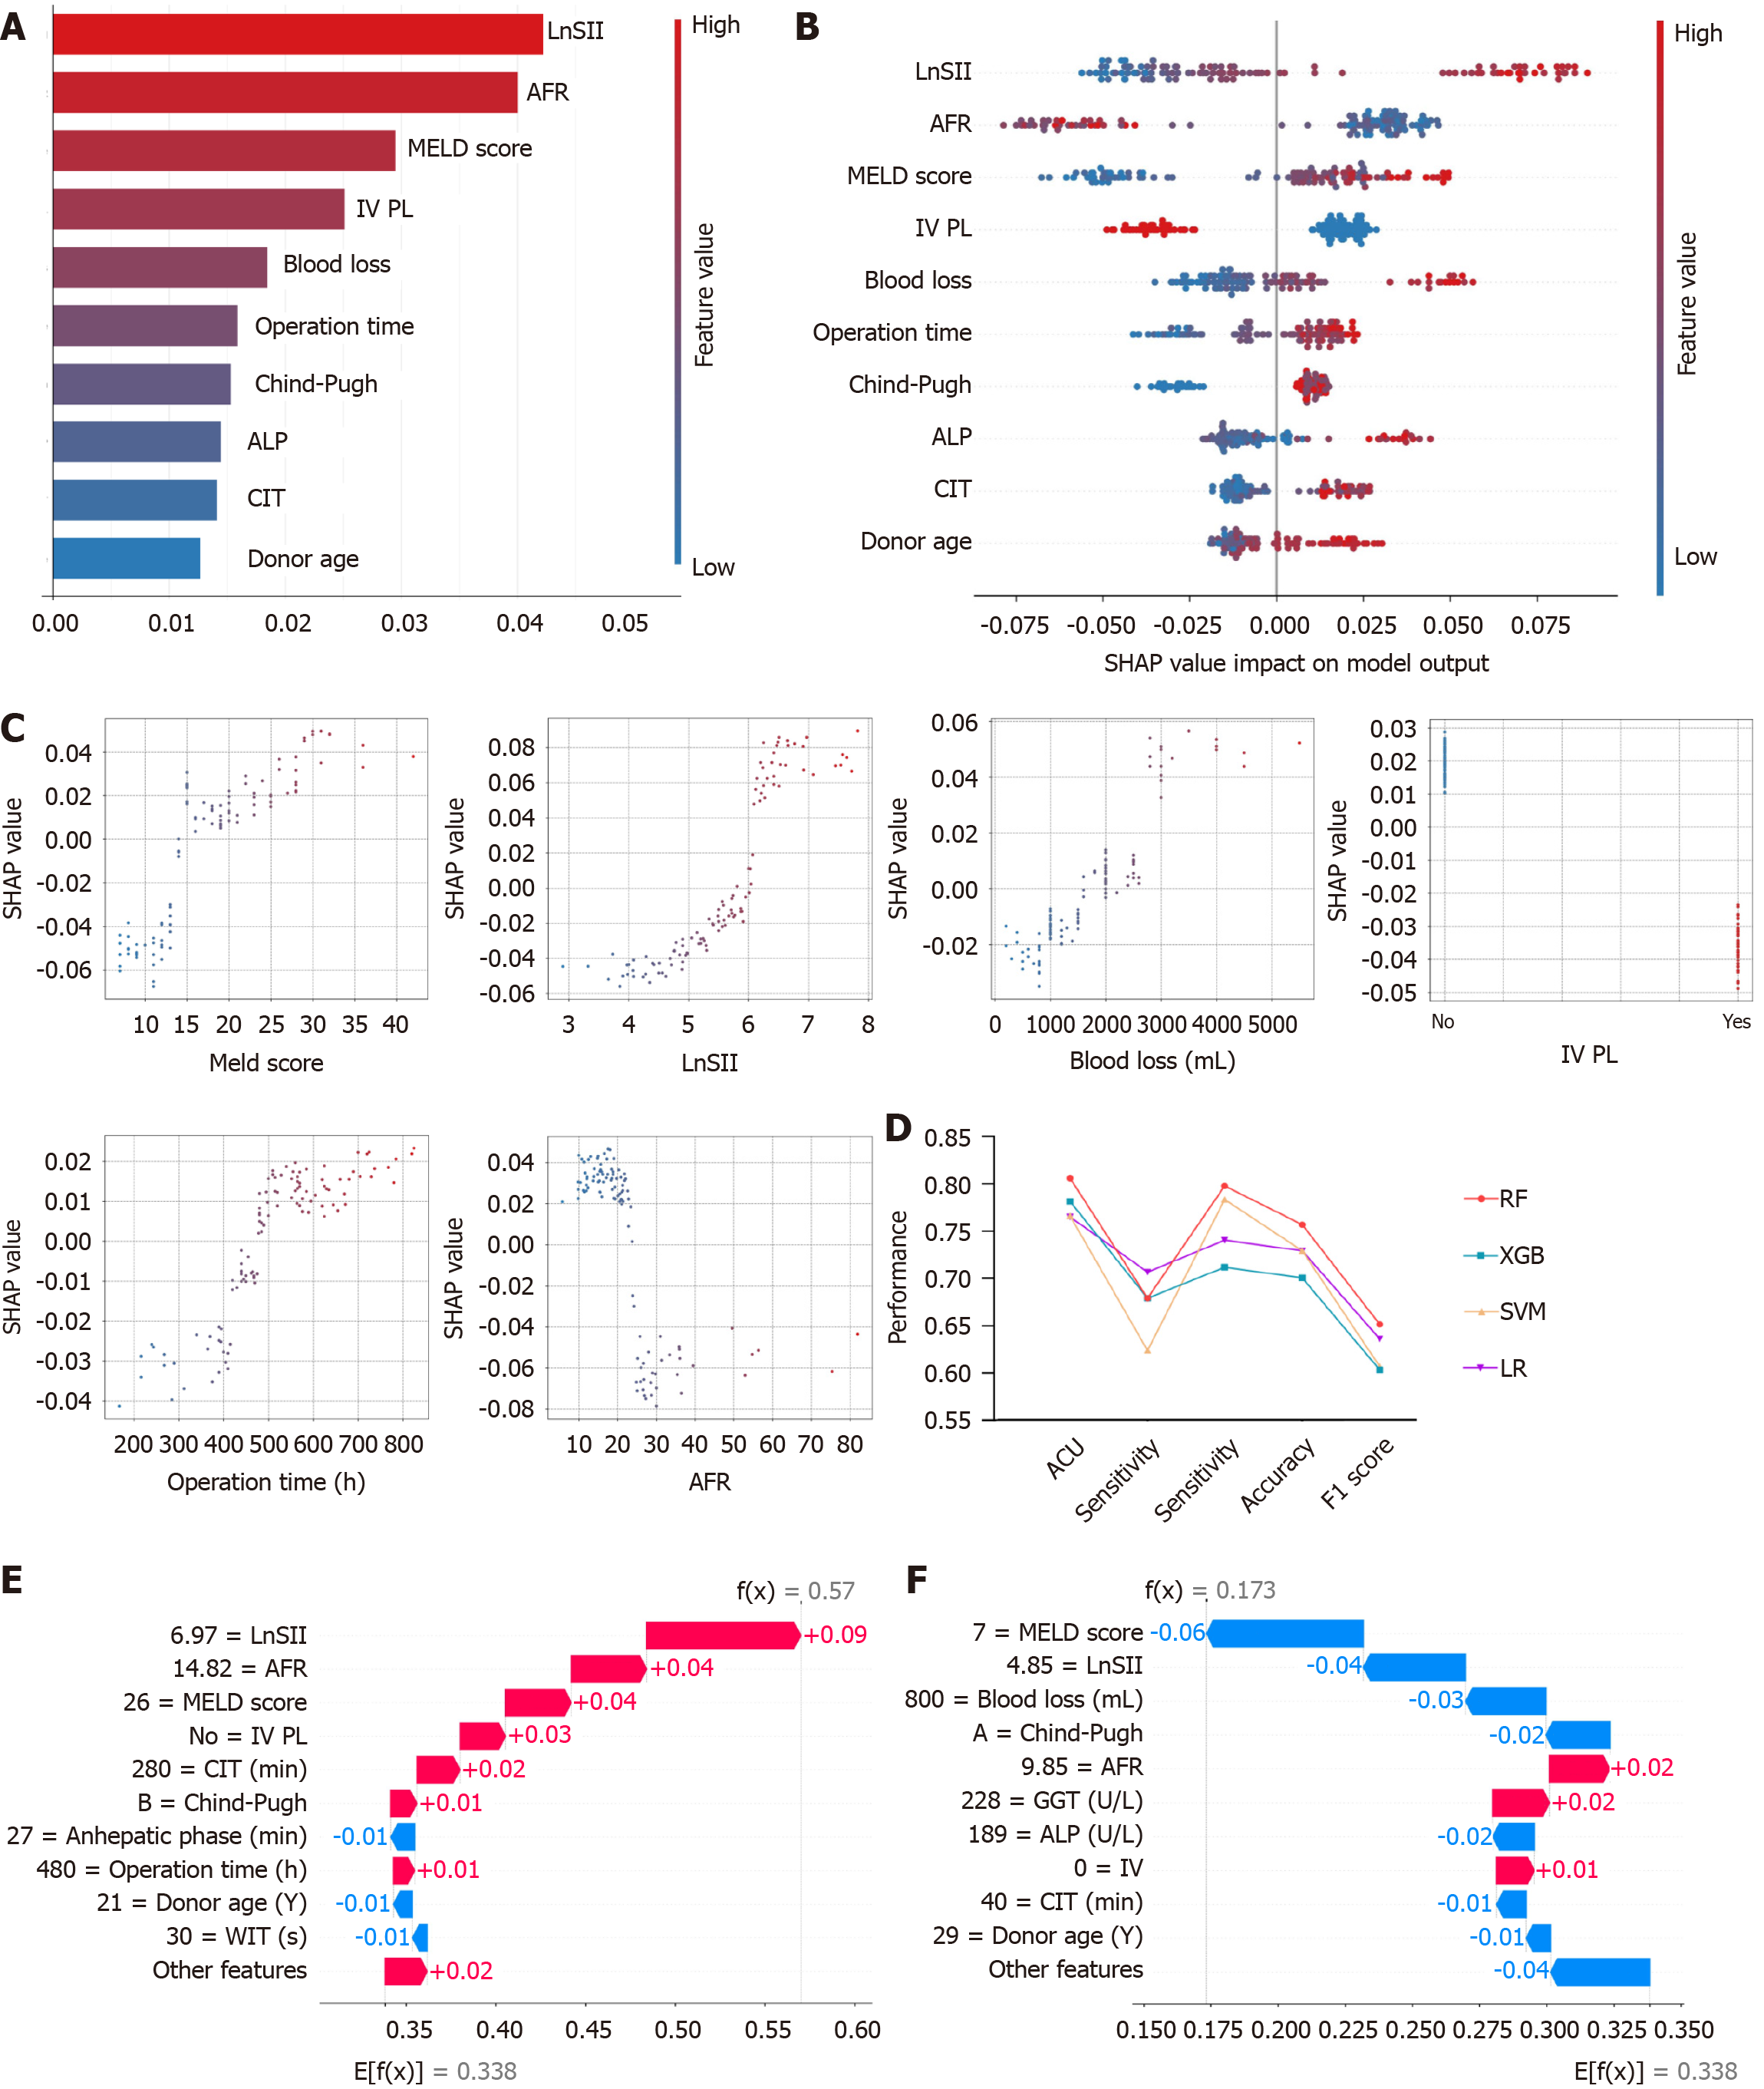
Figure 2 Global model explanation by the SHapley Additive exPlanations method.
A: SHapley Additive exPlanations (SHAP) summary bar plot; B: SHAP summary dot plot. The probability of acute kidney injury development increases with the SHAP value of a feature. A dot is made for SHAP value in the model for each single patient, so each patient has one dot on the line for each feature. The colors of the dots demonstrate the actual values of the features for each patient, as red means a higher feature value and blue means a lower feature value. The dots are stacked vertically to show density; C: SHAP dependence plot. Each dependence plot shows how a single feature affects the output of the prediction model, and each dot represents a single patient; D: Performance metrics of the four machine learning models in the cohort; E and F: Waterfall plots demonstrating individual patient feature contributions towards risk classification: Panel E indicates a patient classified as “early postoperative complications”, panel F a patient classified as “non-early postoperative complications”. LnSII: Log-transformed systemic immune inflammatory index; IV PL: Partial lobectomy of segment IV; AFR: Albumin-to-fibrinogen ratio; MELD: Model for end-stage liver disease; RF: Random forest; SVM: Support vector machine; XGB: Extreme gradient boosting; LR: Logistic regression; ALP: Alkaline phosphatase; CIT: Cold ischemia time; SHAP: SHapley Additive exPlanations; WIT: Warm ischemia time; GGT: Gamma-glutamyl transferase.
- Citation: Wang D, Zhang JY, Xie Y, Zhang KN, Jiang WT. Interpretable machine learning model for early complication prediction after split liver transplantation. World J Gastroenterol 2025; 31(47): 114370
- URL: https://www.wjgnet.com/1007-9327/full/v31/i47/114370.htm
- DOI: https://dx.doi.org/10.3748/wjg.v31.i47.114370