
















©The Author(s) 2025.
World J Gastroenterol. Dec 21, 2025; 31(47): 113776
Published online Dec 21, 2025. doi: 10.3748/wjg.v31.i47.113776
Published online Dec 21, 2025. doi: 10.3748/wjg.v31.i47.113776
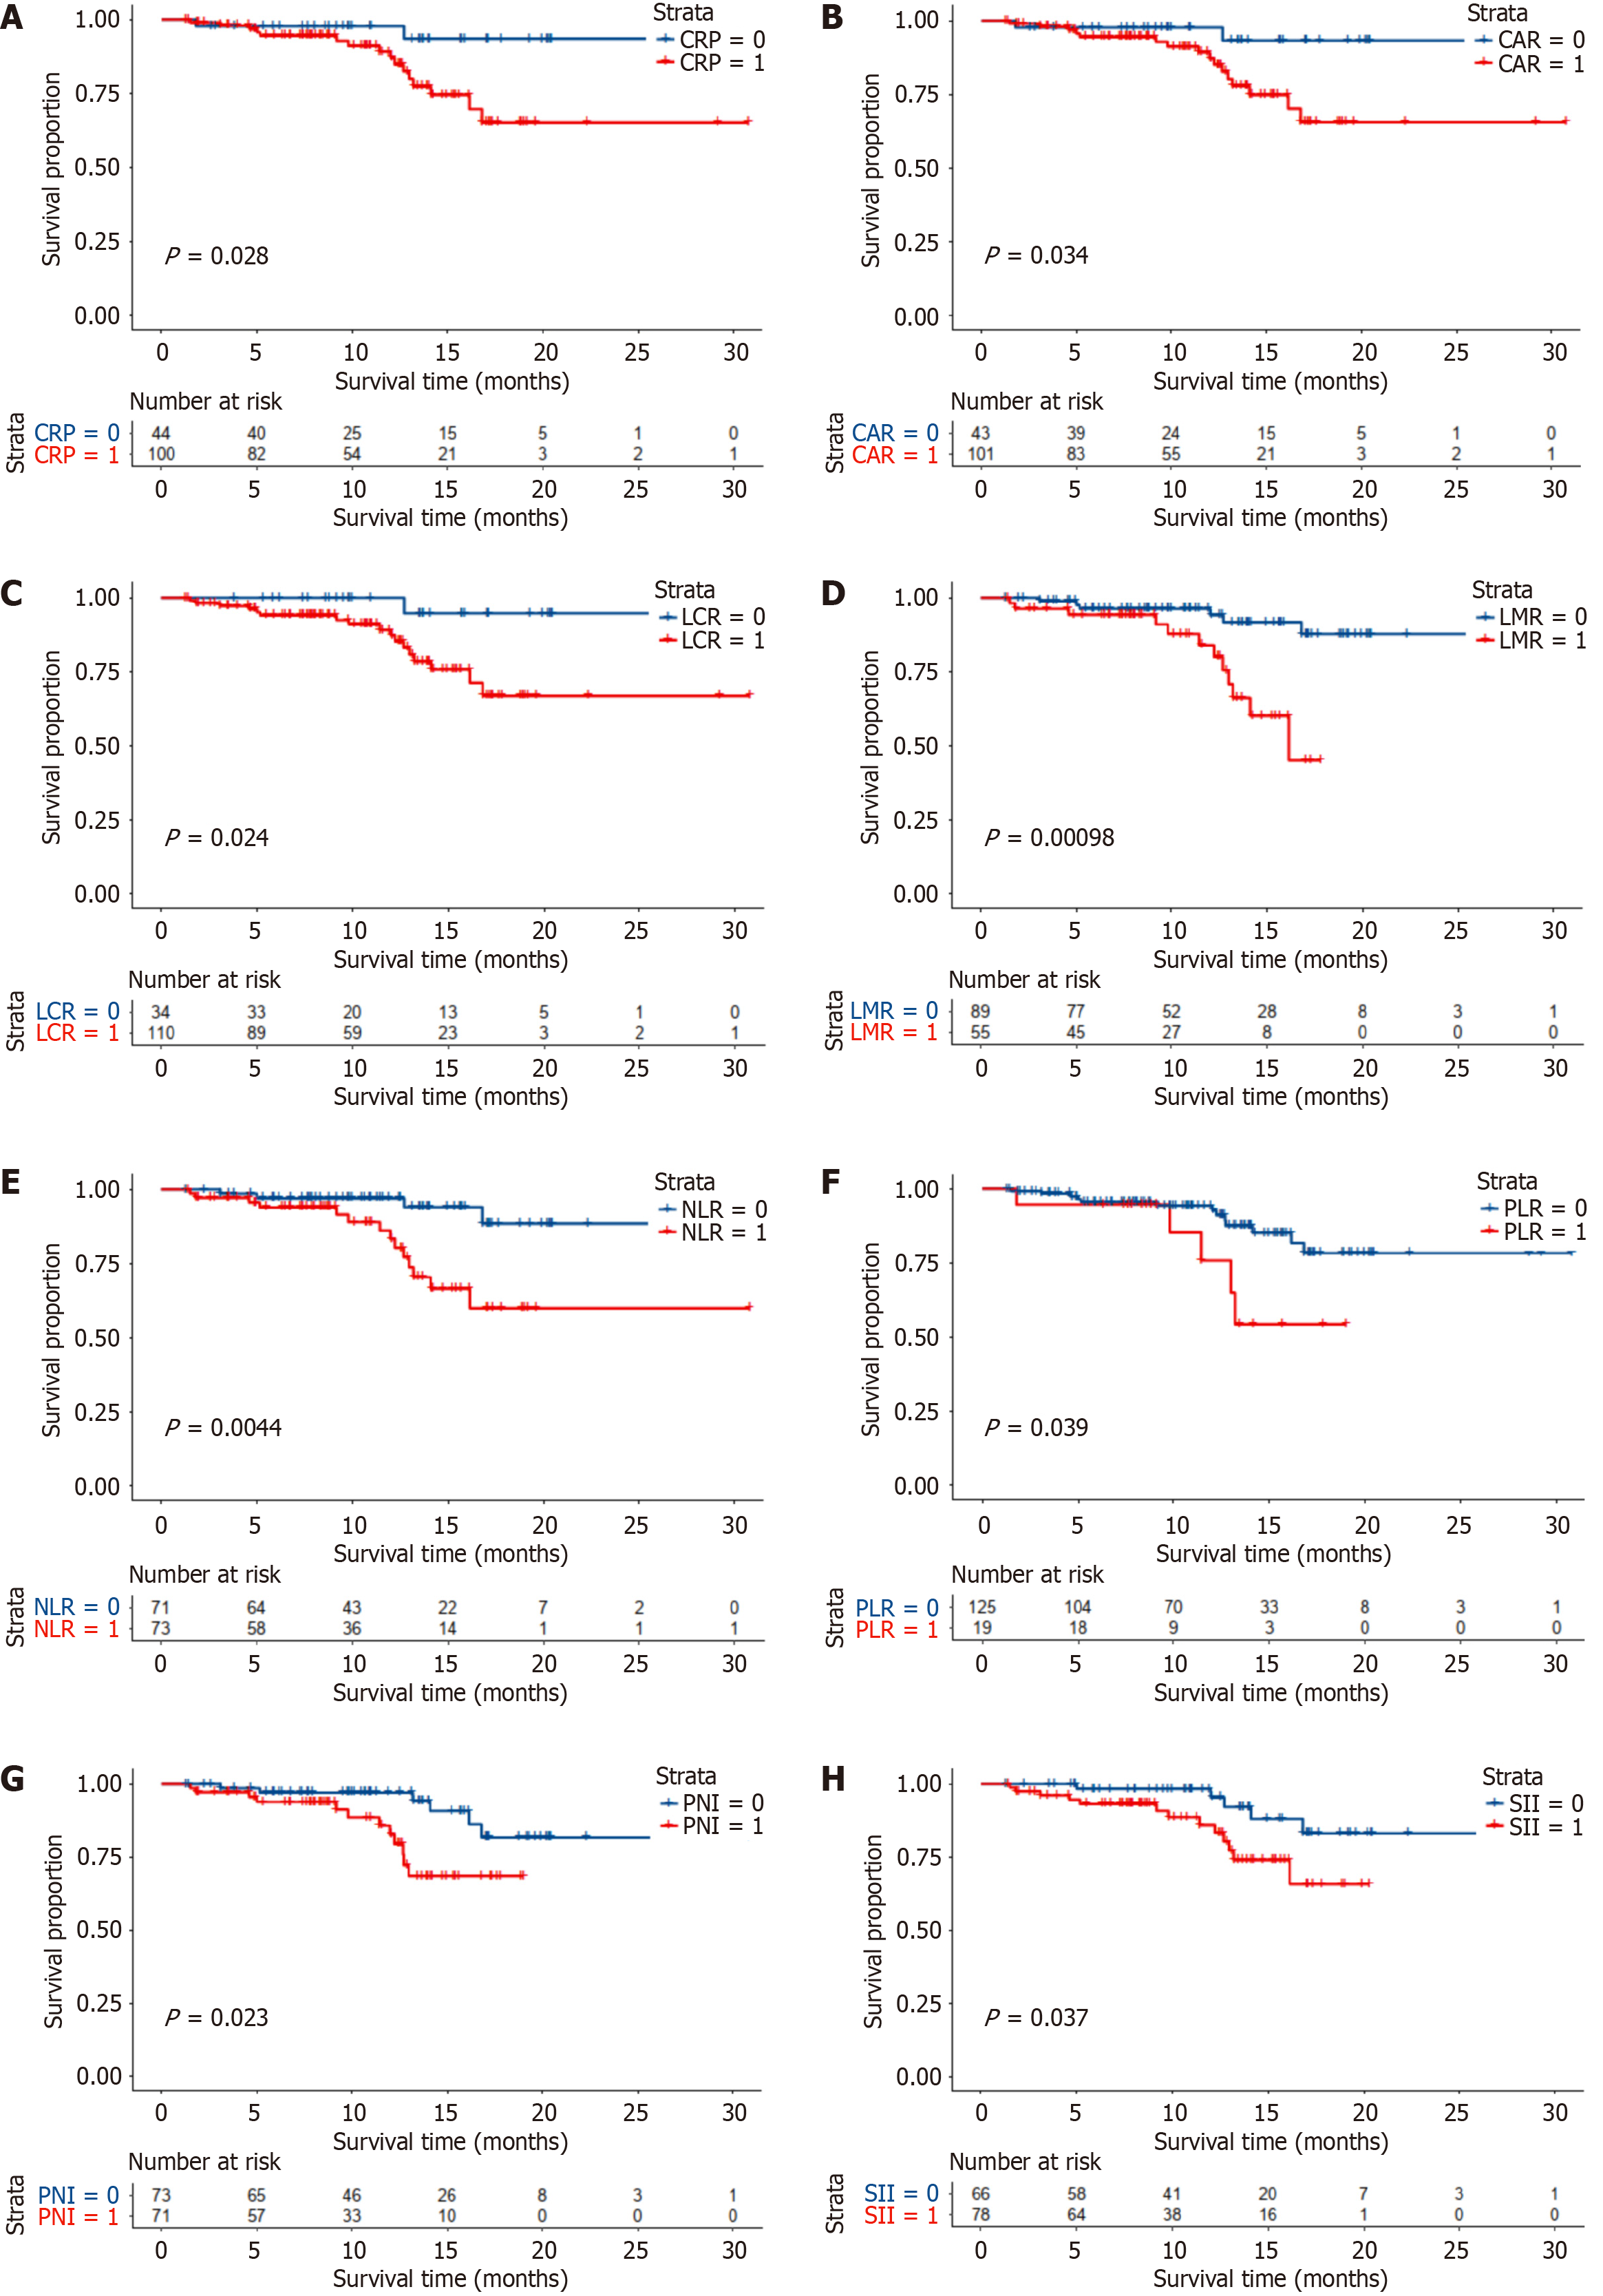
Figure 1 Kaplan-Meier curves of the overall survival of hepatocellular carcinoma patients after Lenvatinib therapy.
A: C-reactive protein; B: C-reactive protein-to-albumin ratio; C: Lymphocyte-to-C-reactive protein ratio; D: Lymphocyte-to-monocyte ratio; E: Neutrophil-to-lymphocyte ratio; F: Platelet-to-lymphocyte ratio; G: Prognostic nutritional index; H: Systemic immune-inflammation index. CRP: C-reactive protein; PLR: Platelet-to-lymphocyte ratio; NLR: Neutrophil-to-lymphocyte ratio; LCR: Lymphocyte-to-C-reactive protein ratio; LMR: Lymphocyte-to-monocyte ratio; SII: Systemic immune-inflammation index; CAR: C-reactive protein-to-albumin ratio; PNI: Prognostic nutritional index.
- Citation: Wu WJ, Wu ZY, Hu DD, Zhou ZG, Chen MS, Zhang YJ, Yang ZY, Chen JB. Comparison of the prognostic value of different inflammation-based scores in patients with hepatocellular carcinoma after Lenvatinib therapy. World J Gastroenterol 2025; 31(47): 113776
- URL: https://www.wjgnet.com/1007-9327/full/v31/i47/113776.htm
- DOI: https://dx.doi.org/10.3748/wjg.v31.i47.113776