
















©The Author(s) 2025.
World J Gastroenterol. Dec 21, 2025; 31(47): 113156
Published online Dec 21, 2025. doi: 10.3748/wjg.v31.i47.113156
Published online Dec 21, 2025. doi: 10.3748/wjg.v31.i47.113156
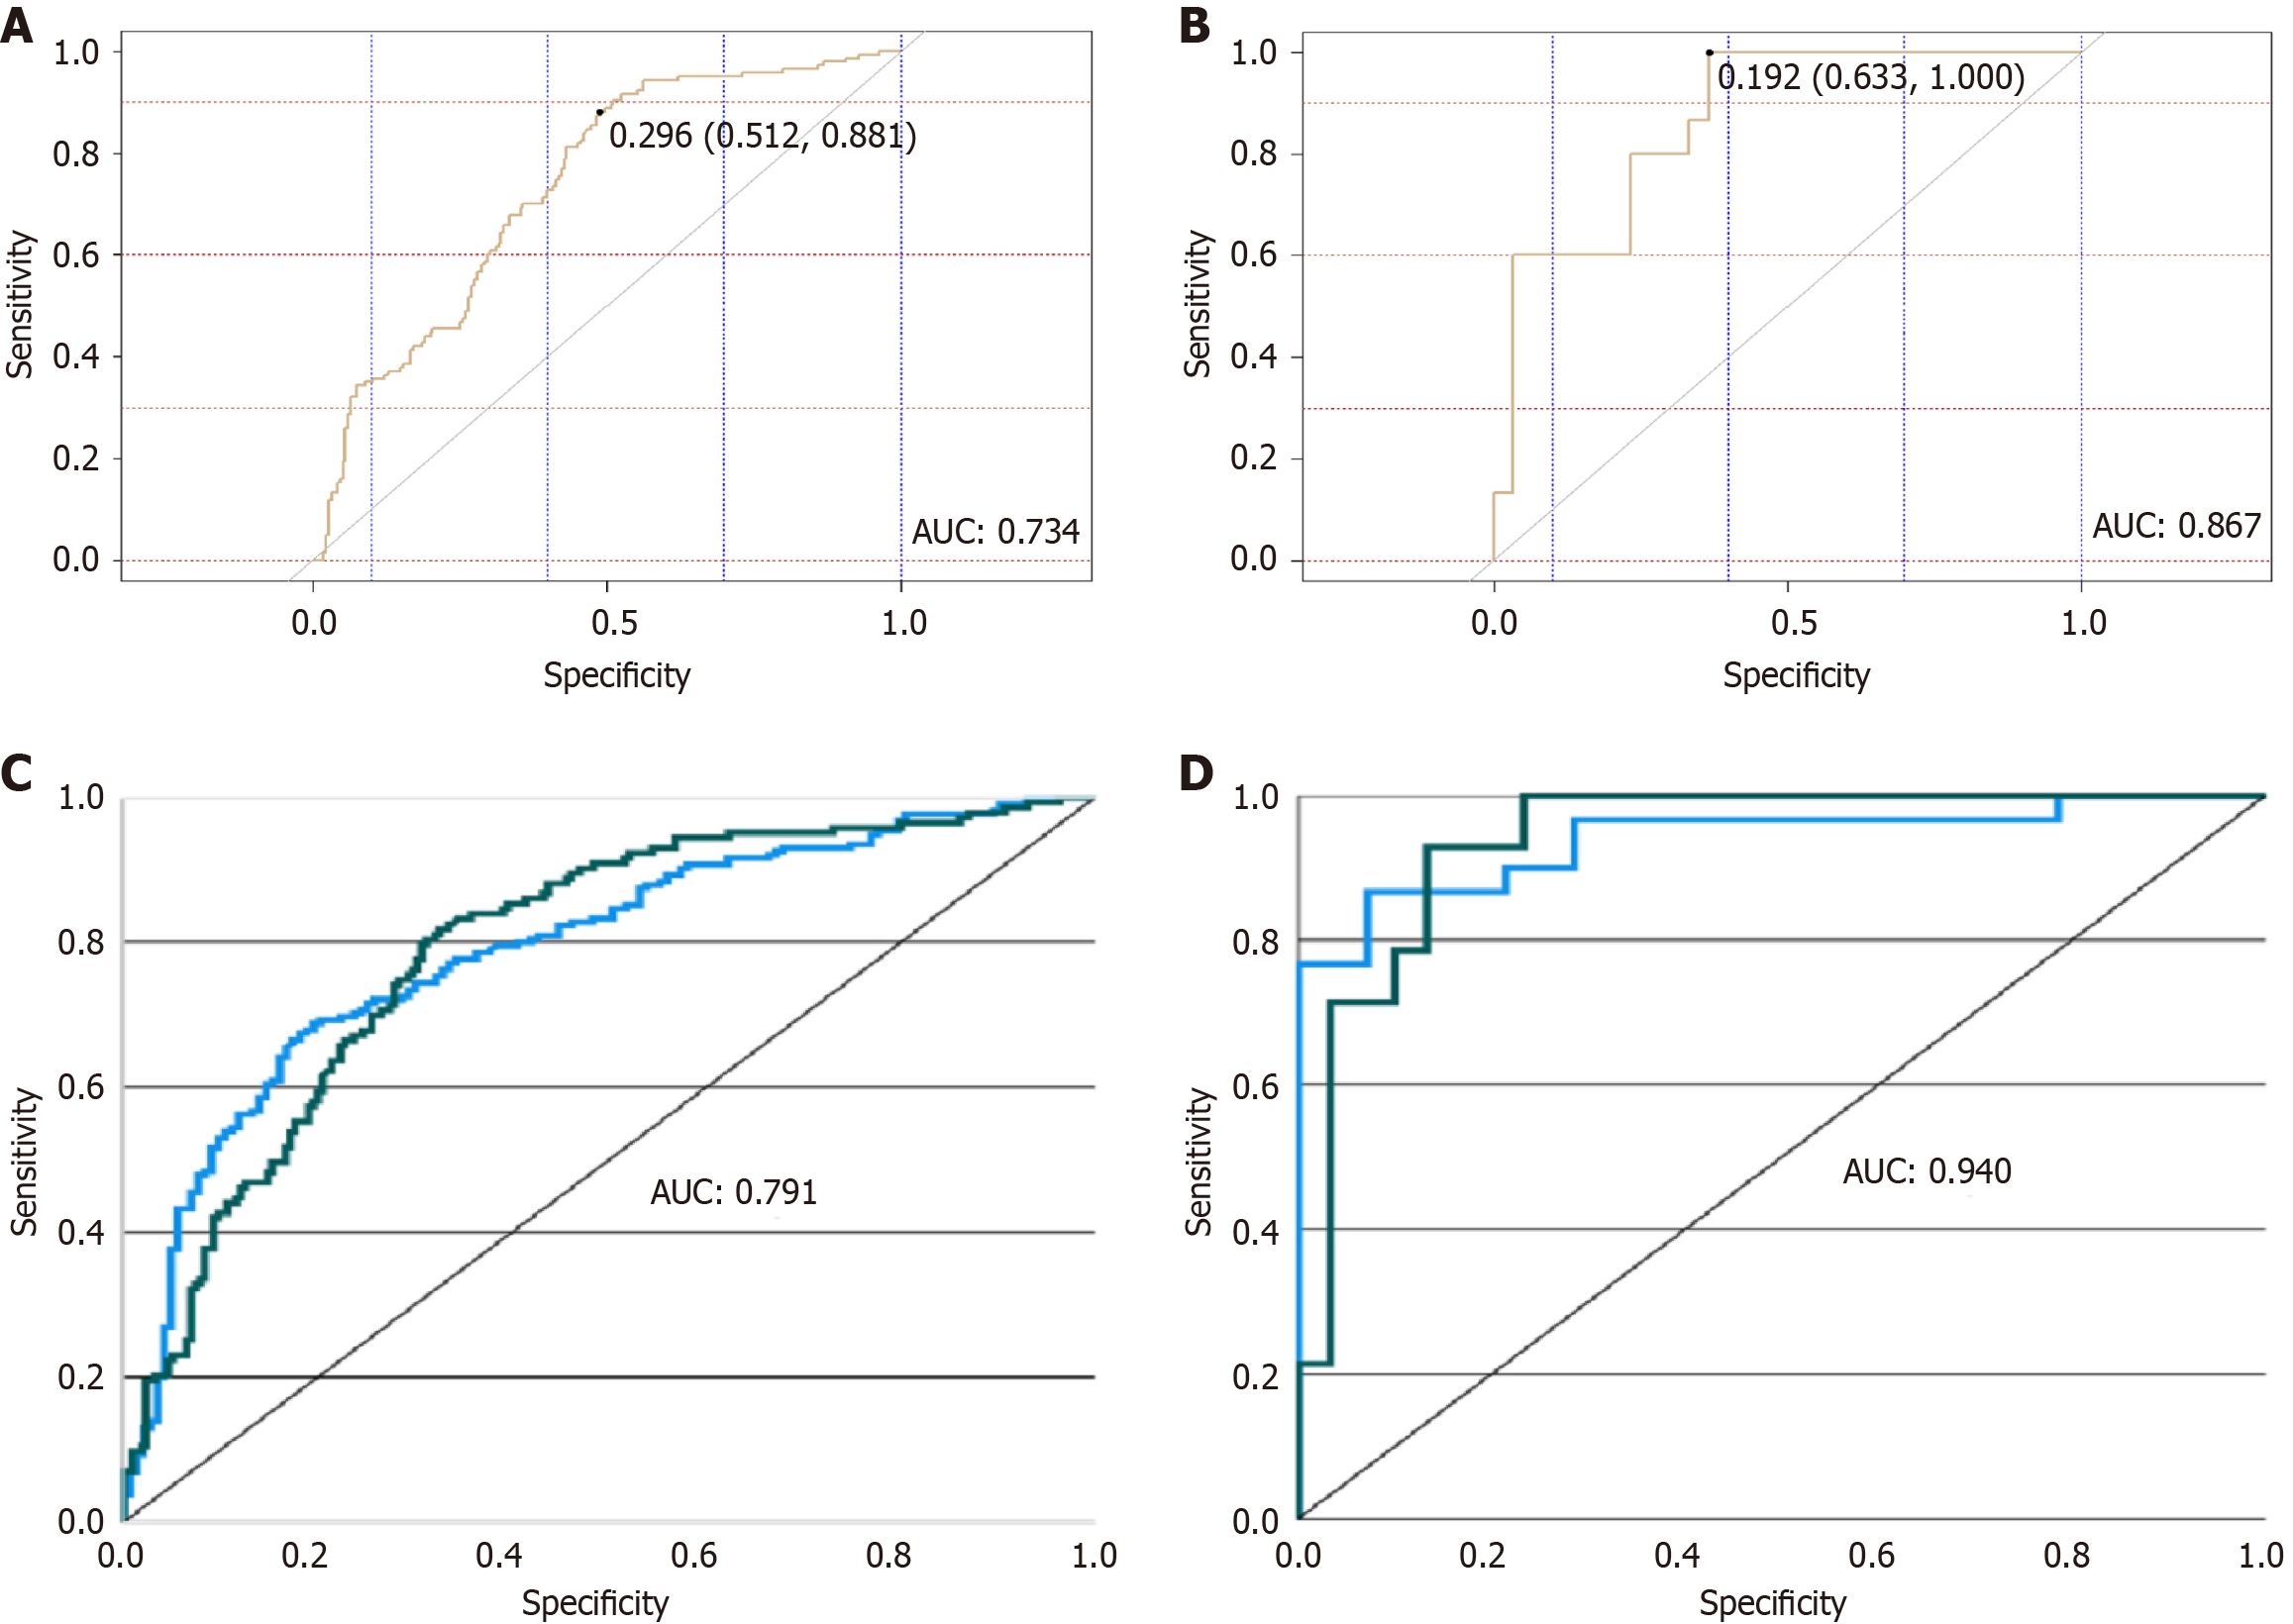
Figure 3 Receiver operating characteristic curves for the prediction models.
A: Receiver operating characteristic (ROC) curve for the logistic regression (LR) modeling group; B: ROC curve for the LR validation group; C: ROC curve for the artificial neural network (ANN) modeling group; D: ROC curve for the ANN validation group. AUC: Area under the curve.
- Citation: Wang YF, Han K, An N, Sun YN, Gao F, Sun Y, Zhang D, Zhao ZF, Guo Q, Gu JN, Yang Z. Risk prediction of biliary infection after endoscopic drainage for malignant perihilar biliary obstruction: A 10-year multicenter retrospective study. World J Gastroenterol 2025; 31(47): 113156
- URL: https://www.wjgnet.com/1007-9327/full/v31/i47/113156.htm
- DOI: https://dx.doi.org/10.3748/wjg.v31.i47.113156