
















©The Author(s) 2025.
World J Gastroenterol. Dec 14, 2025; 31(46): 113585
Published online Dec 14, 2025. doi: 10.3748/wjg.v31.i46.113585
Published online Dec 14, 2025. doi: 10.3748/wjg.v31.i46.113585
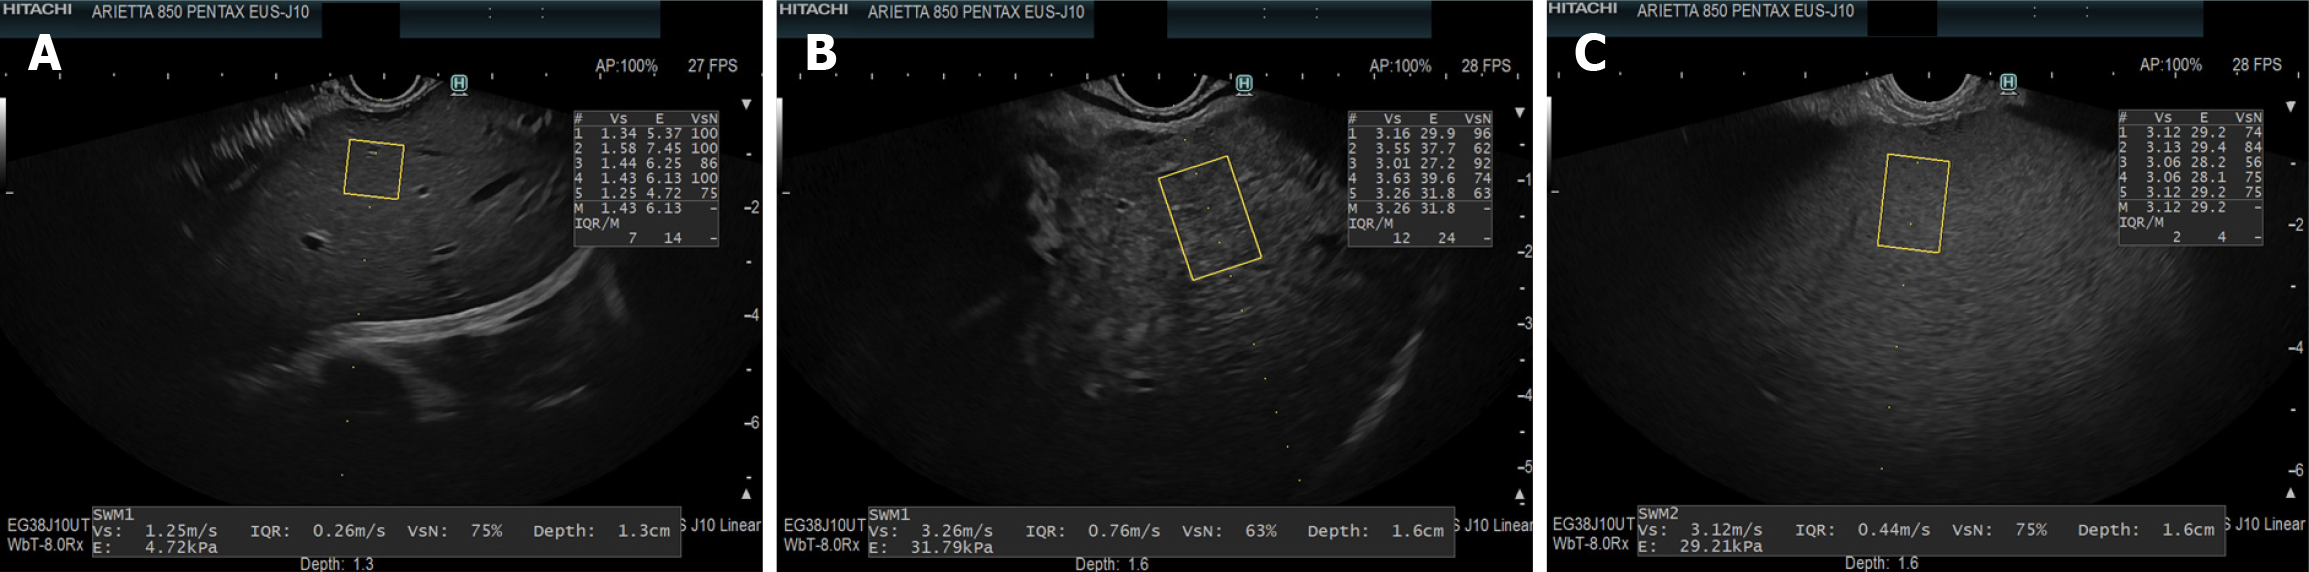
Figure 2 Endoscopic ultrasound-guided shear wave elastography images.
A: Normal liver; B: Cirrhotic liver; C: Spleen. In endoscopic ultrasound-guided shear wave elastography, shear wave velocity is higher in cirrhotic liver compared to normal liver, reflecting increased parenchymal stiffness. Spleen stiffness measurements may provide additional information on the degree of portal hypertension.
- Citation: Paratore M, Miliani S, D’Acunzo G, Viceconti N, Andaloro S, Cerniglia G, Mancuso F, Melita E, Rizzatti G, Gasbarrini A, Riccardi L, Garcovich M. Advances in endoscopic ultrasound-guided shear wave elastography: A comprehensive review of its clinical applications. World J Gastroenterol 2025; 31(46): 113585
- URL: https://www.wjgnet.com/1007-9327/full/v31/i46/113585.htm
- DOI: https://dx.doi.org/10.3748/wjg.v31.i46.113585