
















©The Author(s) 2025.
World J Gastroenterol. Dec 14, 2025; 31(46): 112791
Published online Dec 14, 2025. doi: 10.3748/wjg.v31.i46.112791
Published online Dec 14, 2025. doi: 10.3748/wjg.v31.i46.112791
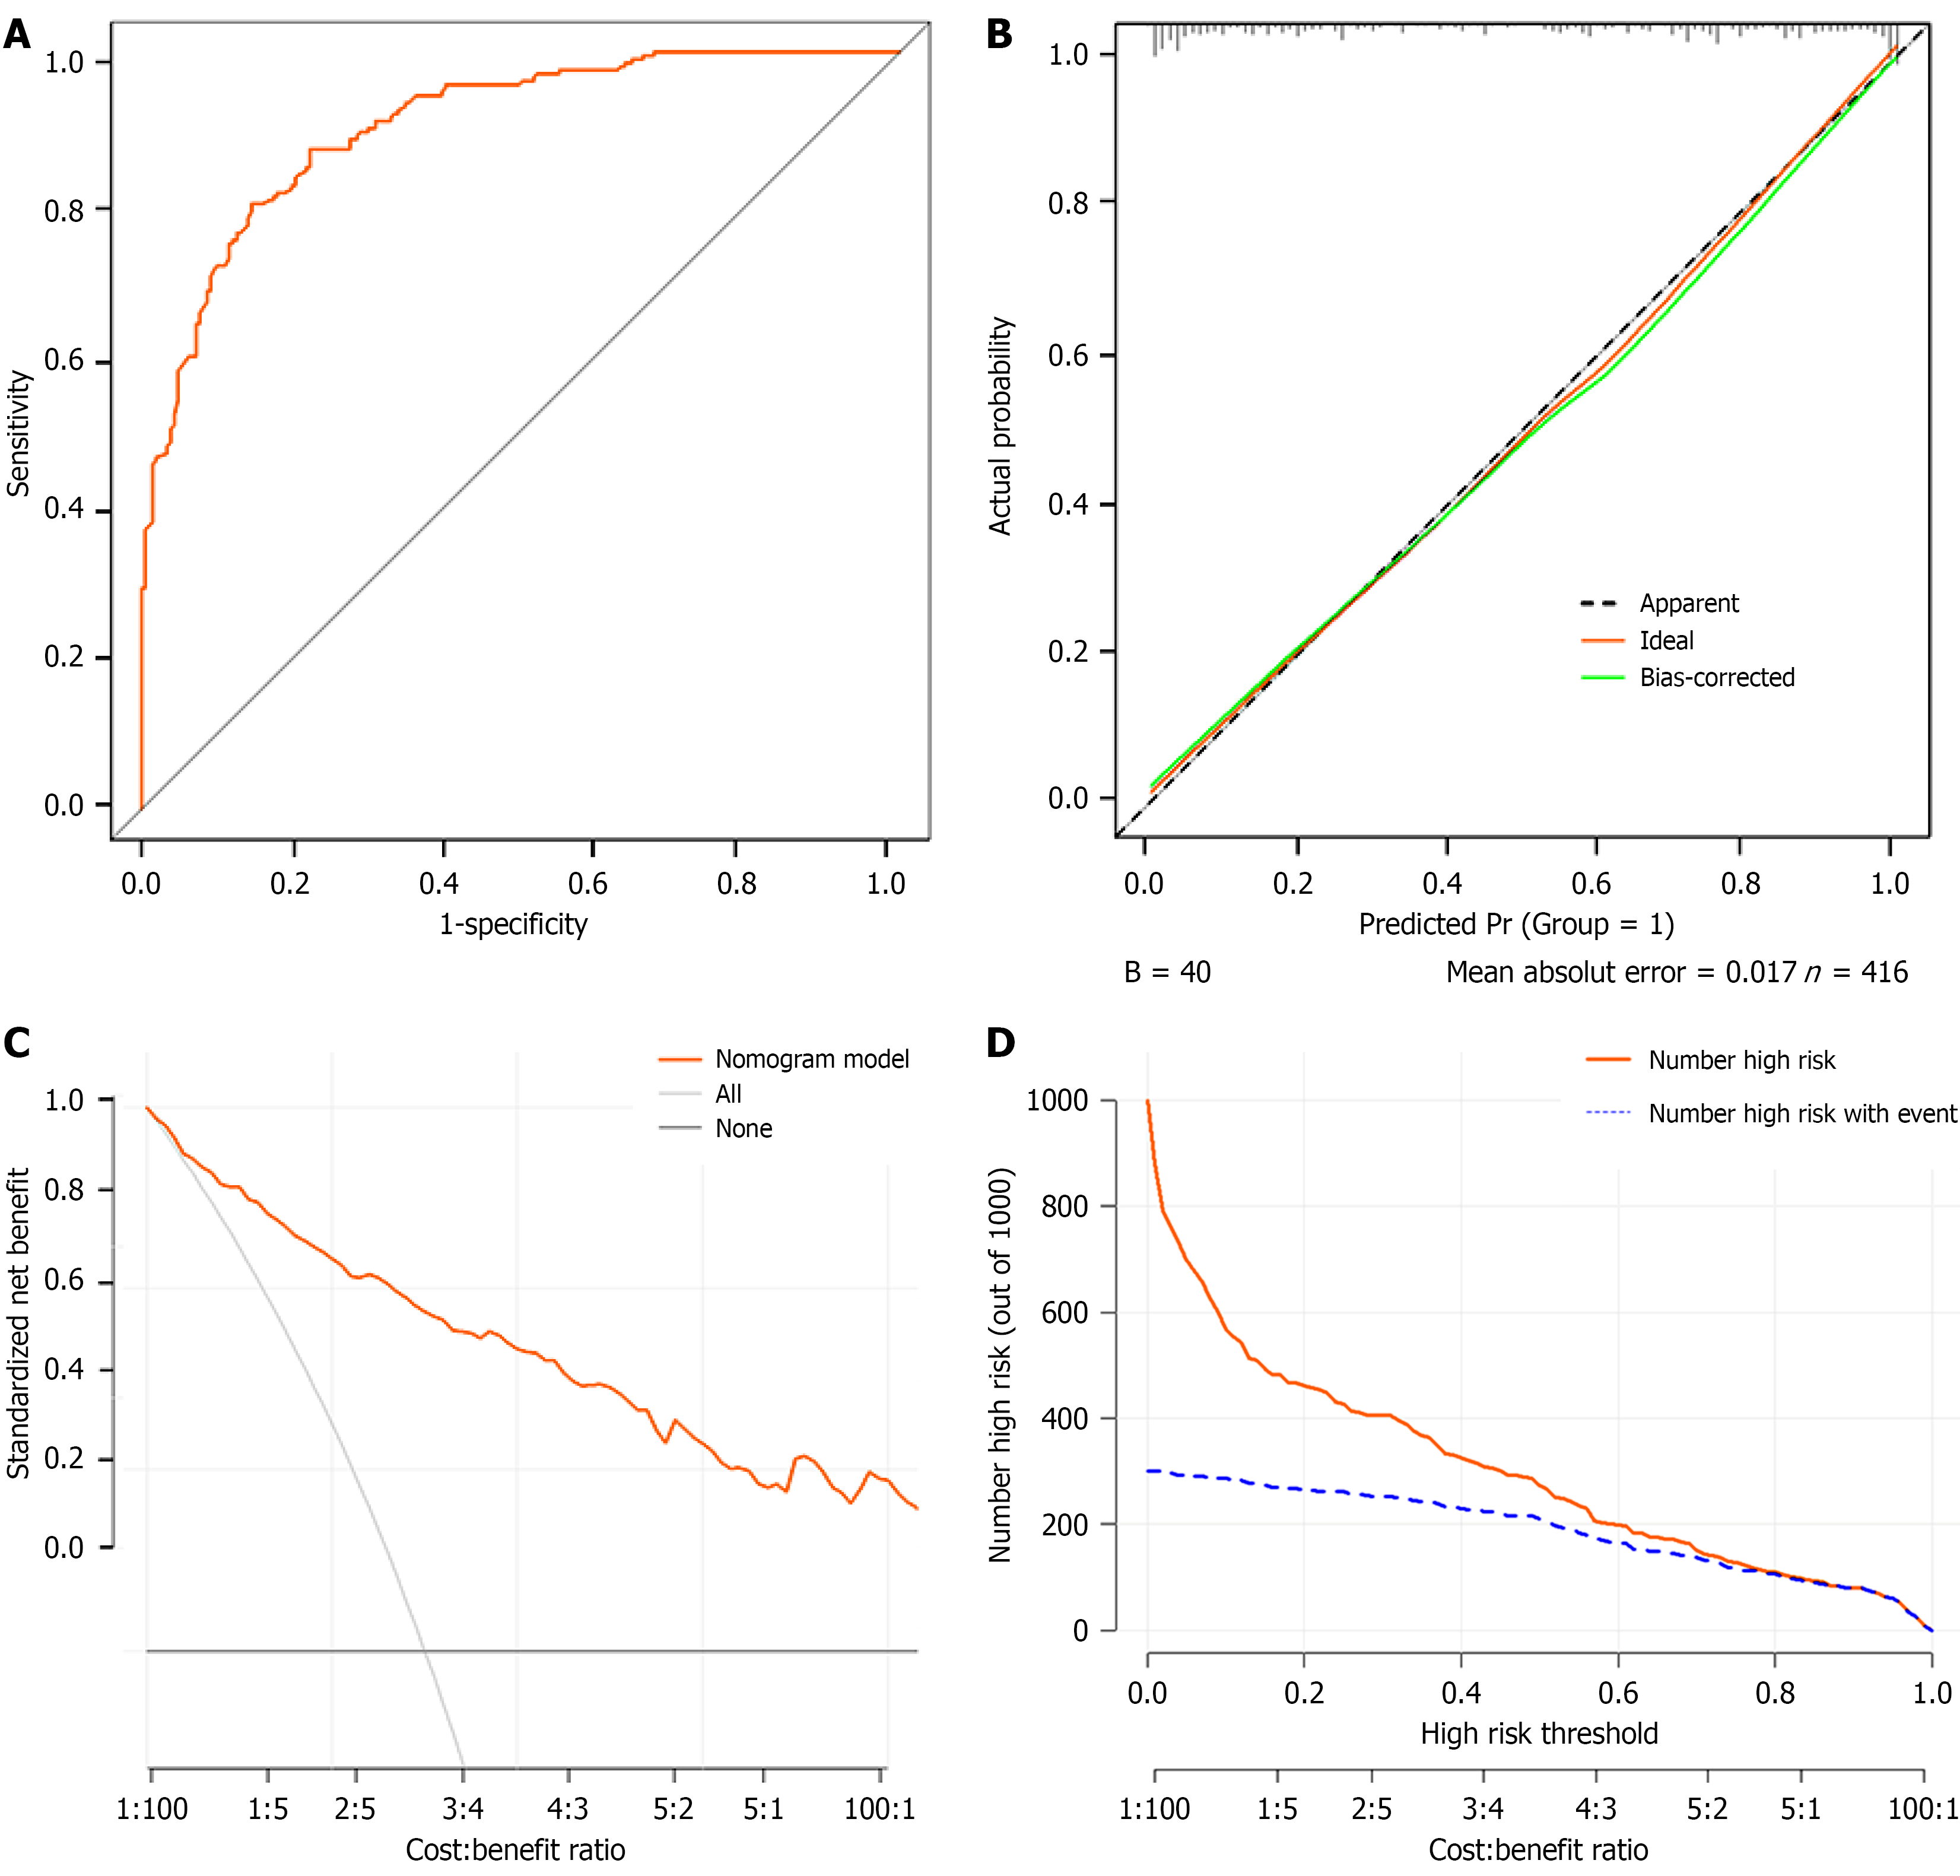
Figure 3 Evaluation of the nomogram for predicting Helicobacter pylori-negative early gastric cancer in the training set.
A: Receiver operating characteristic curve. The area under the curve value of 0.904 indicates excellent discriminatory ability; B: Calibration curve. P value > 0.05 in the Hosmer-Lemeshow test suggested an agreement between the predicted probabilities and observed outcomes; C: Decision curve analysis. The black line represents the assumption of no patient having early gastric cancer (EGC), while the gray line assumes that all patients were diagnosed with EGC. The red line corresponds to the risk nomogram. The model demonstrates clinical utility where its curve exceeds both reference lines across a range of threshold probabilities; D: Clinical impact curve. The “Number High-Risk” curve shows the number of patients who are predicted to be at high risk of EGC by the model. The “Number high-risk with event” curve indicates the true positives among them. The gap between curves corresponds to false positives.
- Citation: Liu XY, Wang YQ, Li P, Zhang ST, Sun XJ. Development and validation of a nomogram incorporating dietary factors for predicting Helicobacter pylori-negative early gastric cancer risk. World J Gastroenterol 2025; 31(46): 112791
- URL: https://www.wjgnet.com/1007-9327/full/v31/i46/112791.htm
- DOI: https://dx.doi.org/10.3748/wjg.v31.i46.112791