
















©The Author(s) 2025.
World J Gastroenterol. Dec 14, 2025; 31(46): 112664
Published online Dec 14, 2025. doi: 10.3748/wjg.v31.i46.112664
Published online Dec 14, 2025. doi: 10.3748/wjg.v31.i46.112664
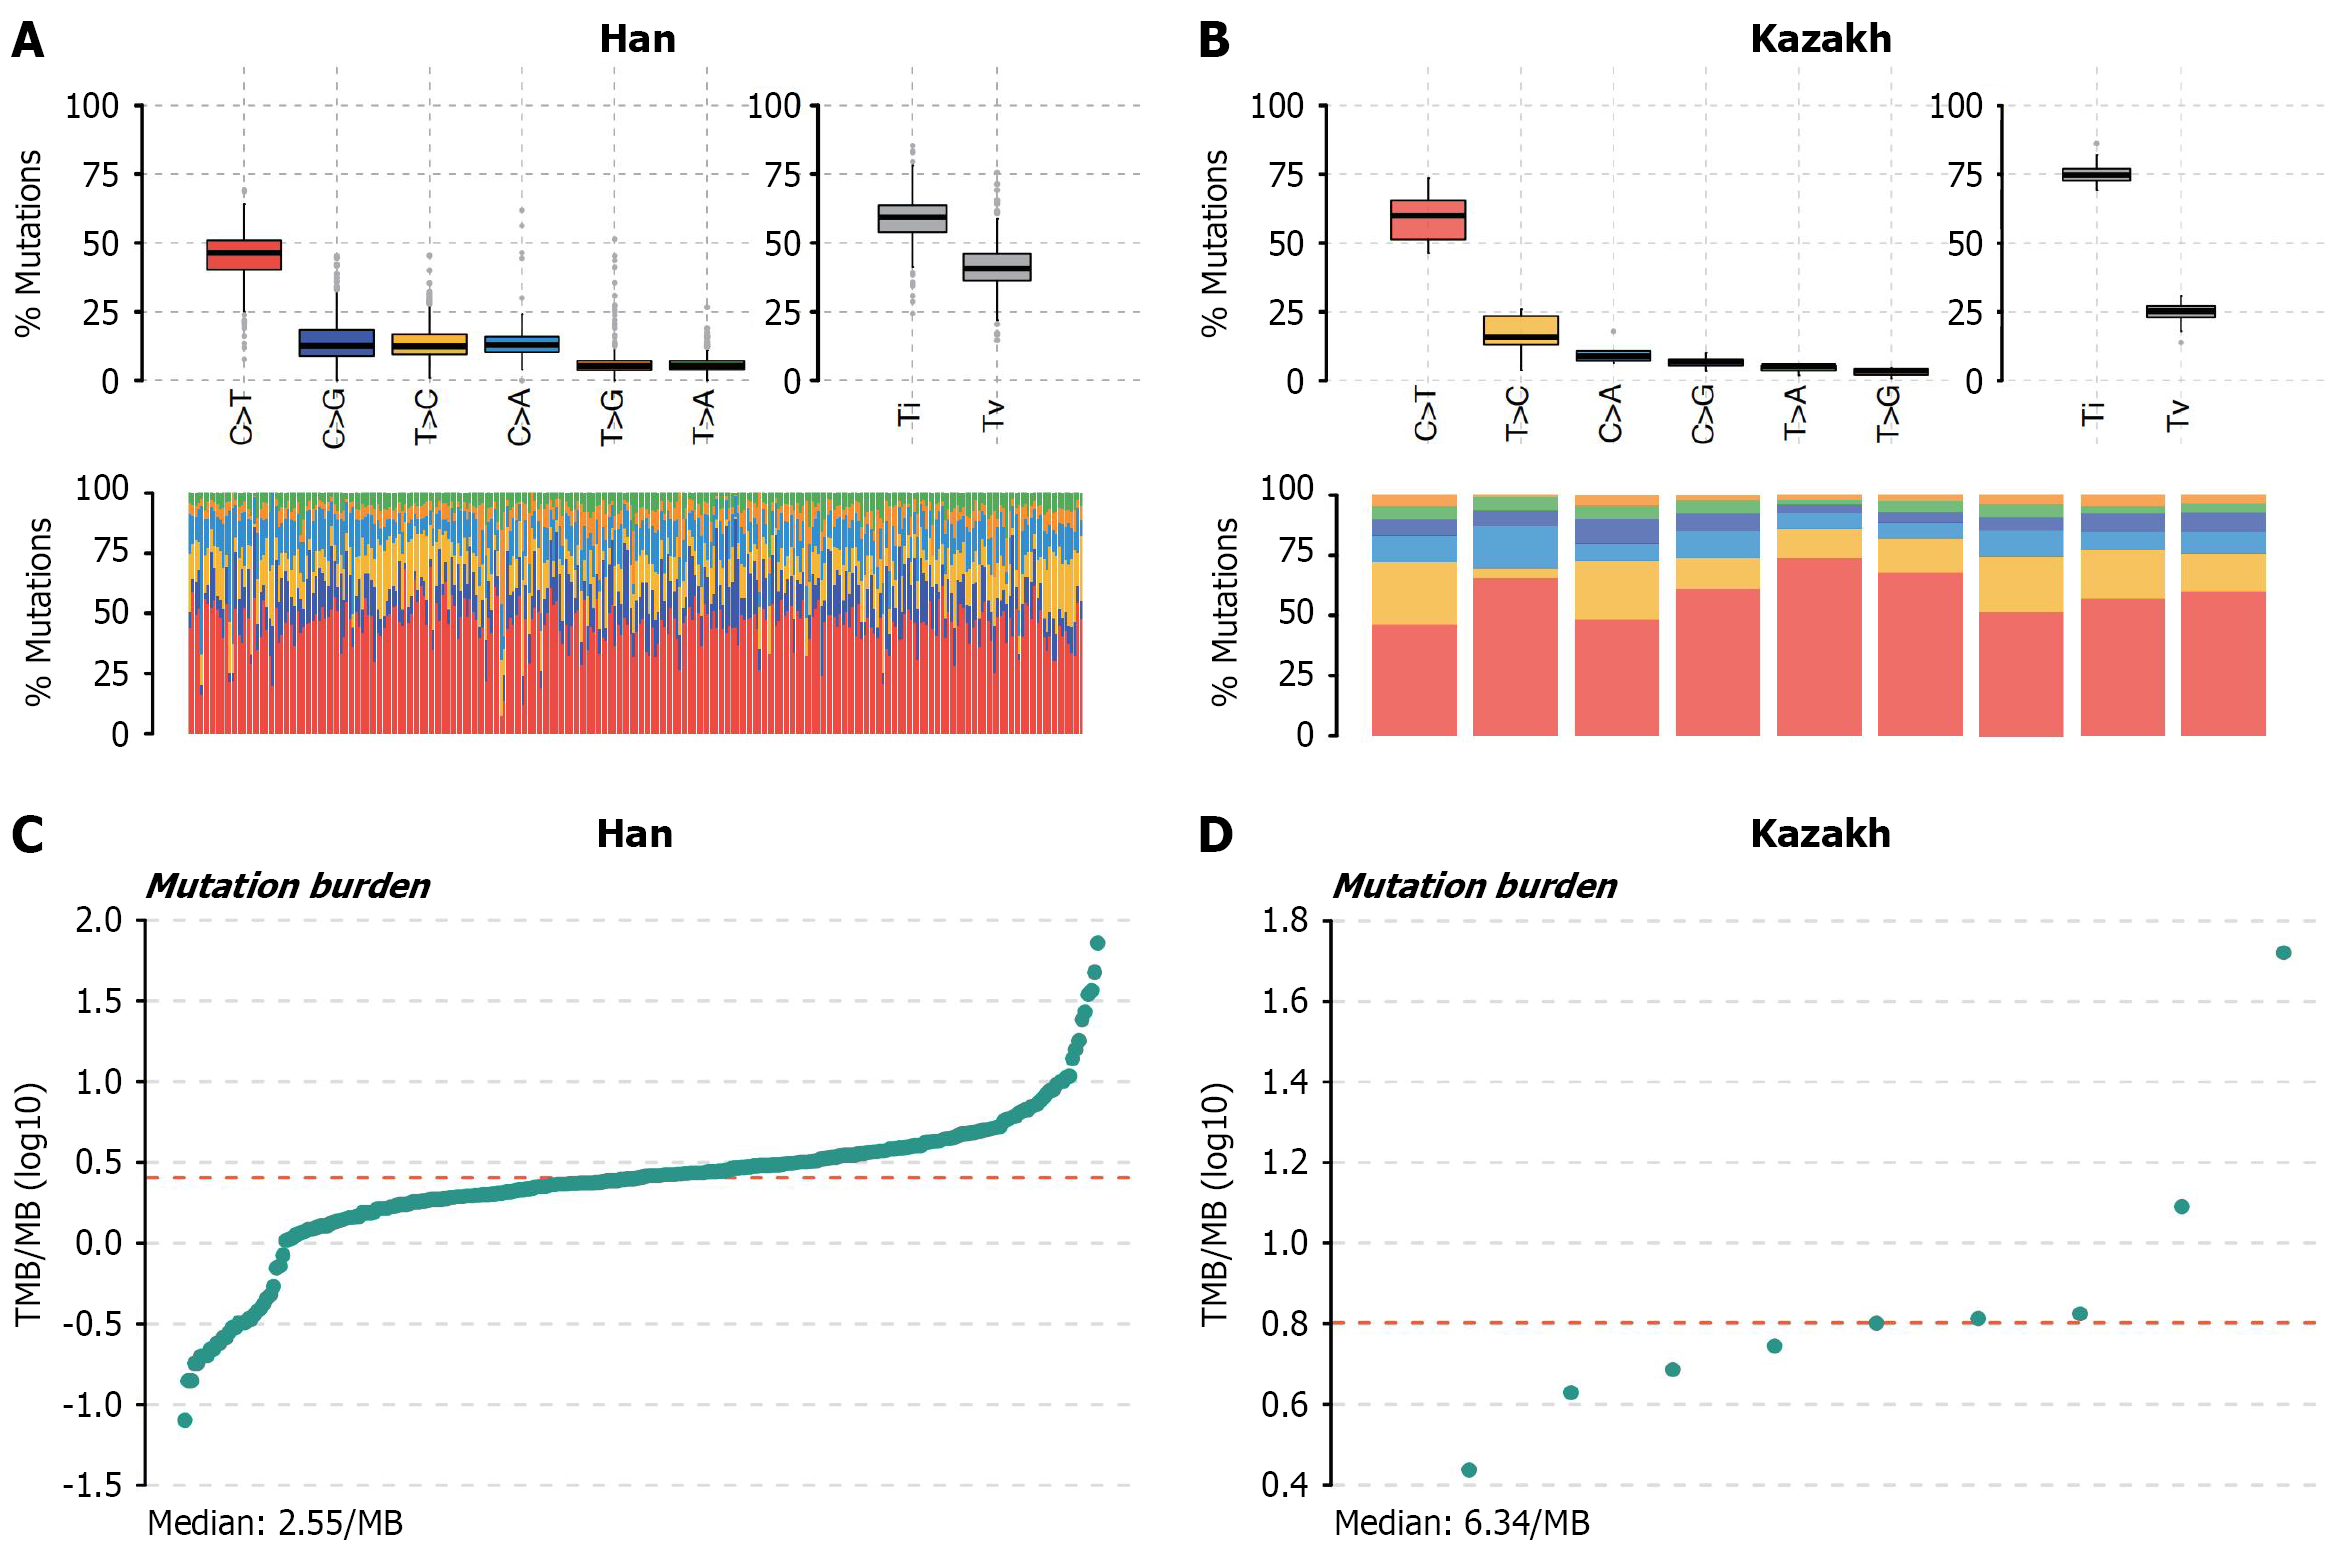
Figure 3 Variant calling and mutation burden.
A and B: The transition and transversion plot illustrates the distribution of single-nucleotide variants (above) in esophageal squamous cell carcinoma, categorized into six transition and transversion events. The core purpose is to describe the distribution characteristics (such as central tendency, dispersion degree, outliers, etc.) of a single set of data (for example, a certain transformation/transposition event). The stacked bar chart (bottom) displays the mutational spectrum distribution of each sample in the multiple alignment format file. Present the “proportion distribution of categorical data” in a visual way to assist in understanding the heterogeneity of the mutation spectrum among different samples; C and D: Mutation burden. The core is to describe the distribution characteristics of tumor mutational burden among the samples, including the central tendency (such as the median) and the degree of dispersion (such as the range of variation). TMB: Tumor mutation burden; MB: Mega base.
- Citation: Wei MX, Lei LL, Xu RH, Liu YX, Wang R, Han WL, Fan ZM, Xiao FK, Sheyhidin I, Ma L, Ku JW, Yin MZ, Ji AF, Bao QD, Gao SG, Han XN, Li XM, Chen PN, Zhao XK, Song X, Wang LD. Ethnic genomic differences in esophageal squamous cell carcinoma: Whole-exome sequencing of Han and Kazakh populations in China. World J Gastroenterol 2025; 31(46): 112664
- URL: https://www.wjgnet.com/1007-9327/full/v31/i46/112664.htm
- DOI: https://dx.doi.org/10.3748/wjg.v31.i46.112664