
















©The Author(s) 2025.
World J Gastroenterol. Dec 14, 2025; 31(46): 112530
Published online Dec 14, 2025. doi: 10.3748/wjg.v31.i46.112530
Published online Dec 14, 2025. doi: 10.3748/wjg.v31.i46.112530
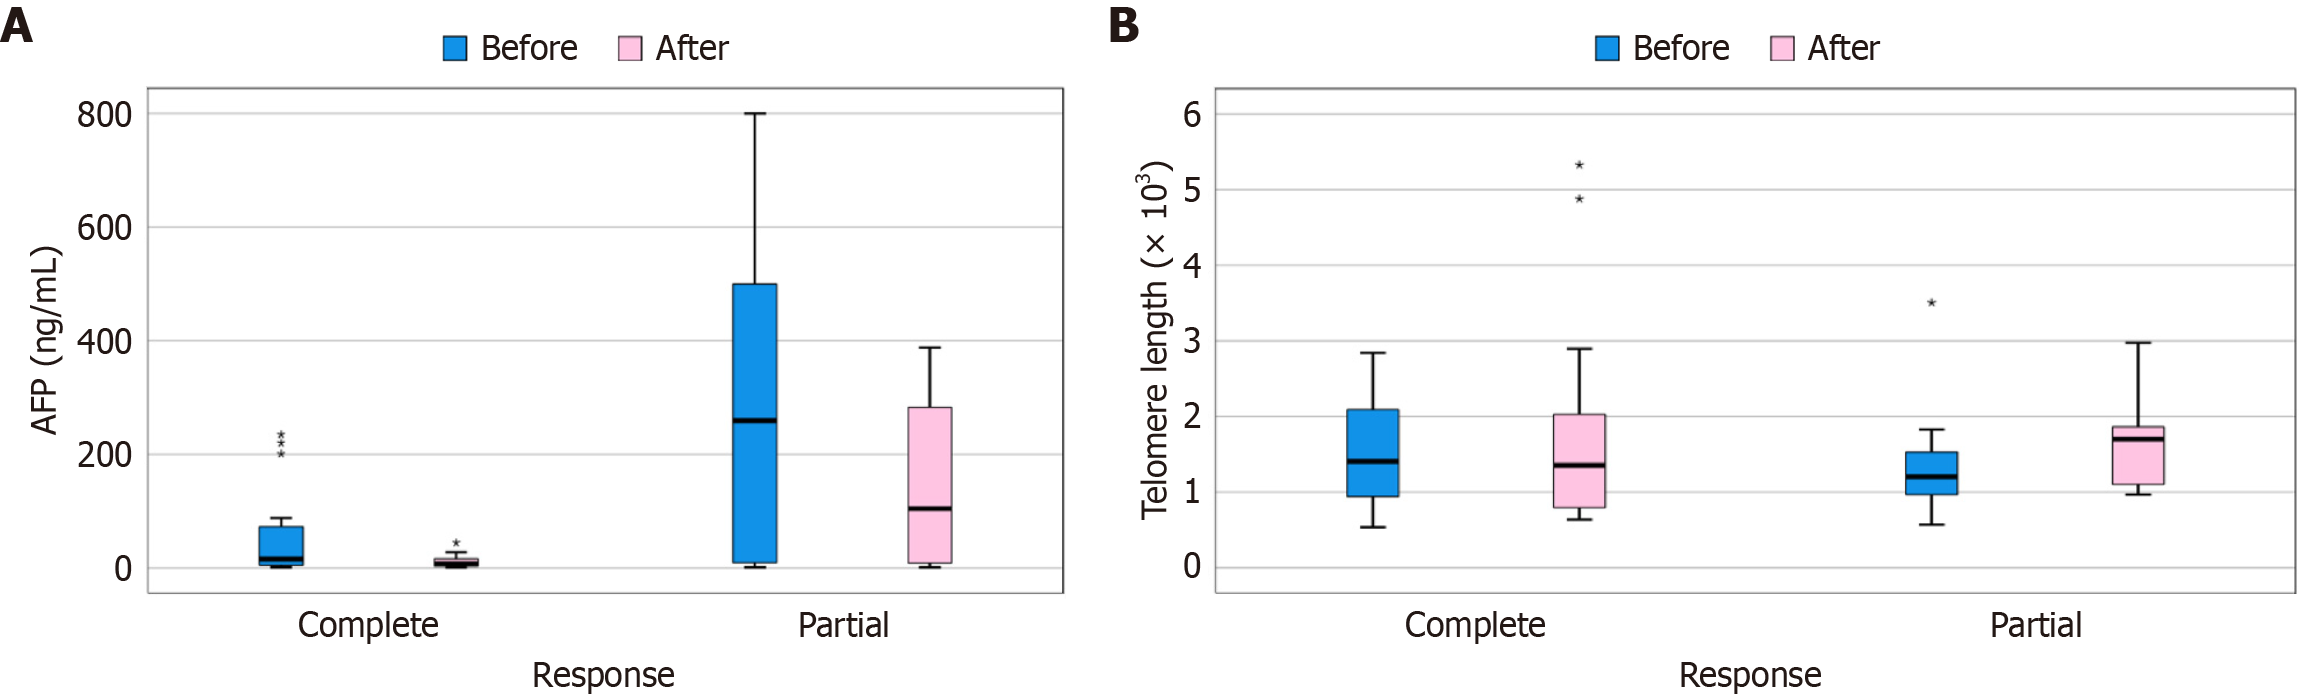
Figure 5 Bar chart graphs showing alpha fetoprotein and telomere length according to tumor response in the hepatocellular carcinoma group.
A: Comparison of alpha fetoprotein before and after treatment according to response in the hepatocellular carcinoma (HCC) group; B: Comparison of telomere length before and after treatment according to response in the HCC group. AFP: Alpha fetoprotein. Asterisks represent the dataset outliers.
- Citation: El-Nakeep S, AbdelAziz H, Michael TG, ElGhandour AM, Abdelsattar HA, Awad FMR, Kasi A. Clinical utility of telomeres as diagnostic and short-term prognostic markers in loco-regional treatment of hepatocellular carcinoma. World J Gastroenterol 2025; 31(46): 112530
- URL: https://www.wjgnet.com/1007-9327/full/v31/i46/112530.htm
- DOI: https://dx.doi.org/10.3748/wjg.v31.i46.112530