















©The Author(s) 2025.
World J Gastroenterol. Nov 28, 2025; 31(44): 112719
Published online Nov 28, 2025. doi: 10.3748/wjg.v31.i44.112719
Published online Nov 28, 2025. doi: 10.3748/wjg.v31.i44.112719
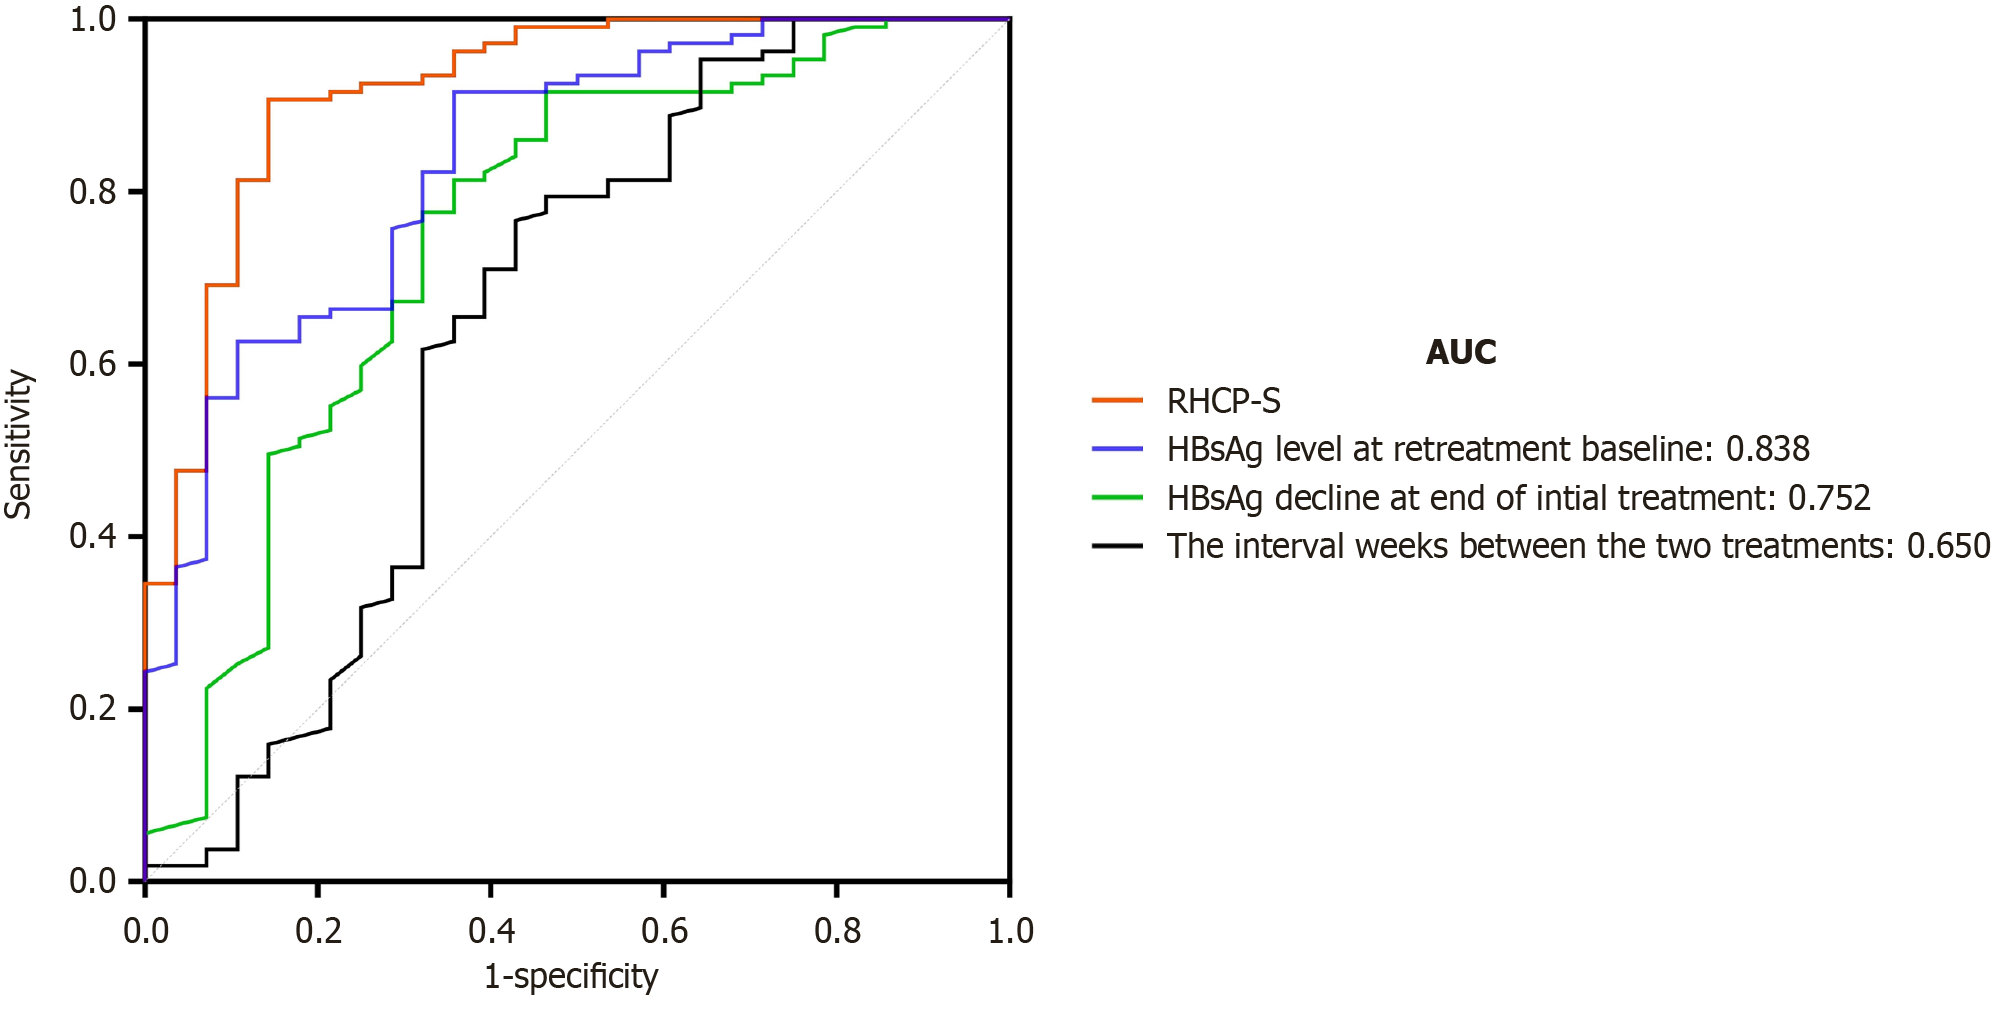
Figure 3 Time-dependent receiver operating characteristic analysis of hepatitis B surface antigen clearance prediction models.
Comparison of the retreatment hepatitis B surface antigen (HBsAg) clearance prediction score (RHCP-S) model vs individual predictors shows superior discrimination for HBsAg clearance [area under the curve (AUC) = 0.920]. Curve comparisons: RHCP-S (red solid line) > retreatment baseline HBsAg (AUC = 0.838, blue solid line) > initial HBsAg decline (AUC = 0.752, green solid line) > treatment interval (AUC = 0.650, black solid line). AUC: Area under curve; HBsAg: Hepatitis B surface antigen; RHCP-S: Retreatment hepatitis B surface antigen clearance prediction score.
- Citation: Fu YC, Li J, Wang JY, Zhang YW, Yan F, Chen J, Du Q, Yang C, Liang J, Ye Q, Xiang HL. Retreatment hepatitis B surface antigen clearance prediction model identifies pegylated interferon alpha candidates in chronic hepatitis B. World J Gastroenterol 2025; 31(44): 112719
- URL: https://www.wjgnet.com/1007-9327/full/v31/i44/112719.htm
- DOI: https://dx.doi.org/10.3748/wjg.v31.i44.112719