
















©The Author(s) 2025.
World J Gastroenterol. Nov 14, 2025; 31(42): 112180
Published online Nov 14, 2025. doi: 10.3748/wjg.v31.i42.112180
Published online Nov 14, 2025. doi: 10.3748/wjg.v31.i42.112180
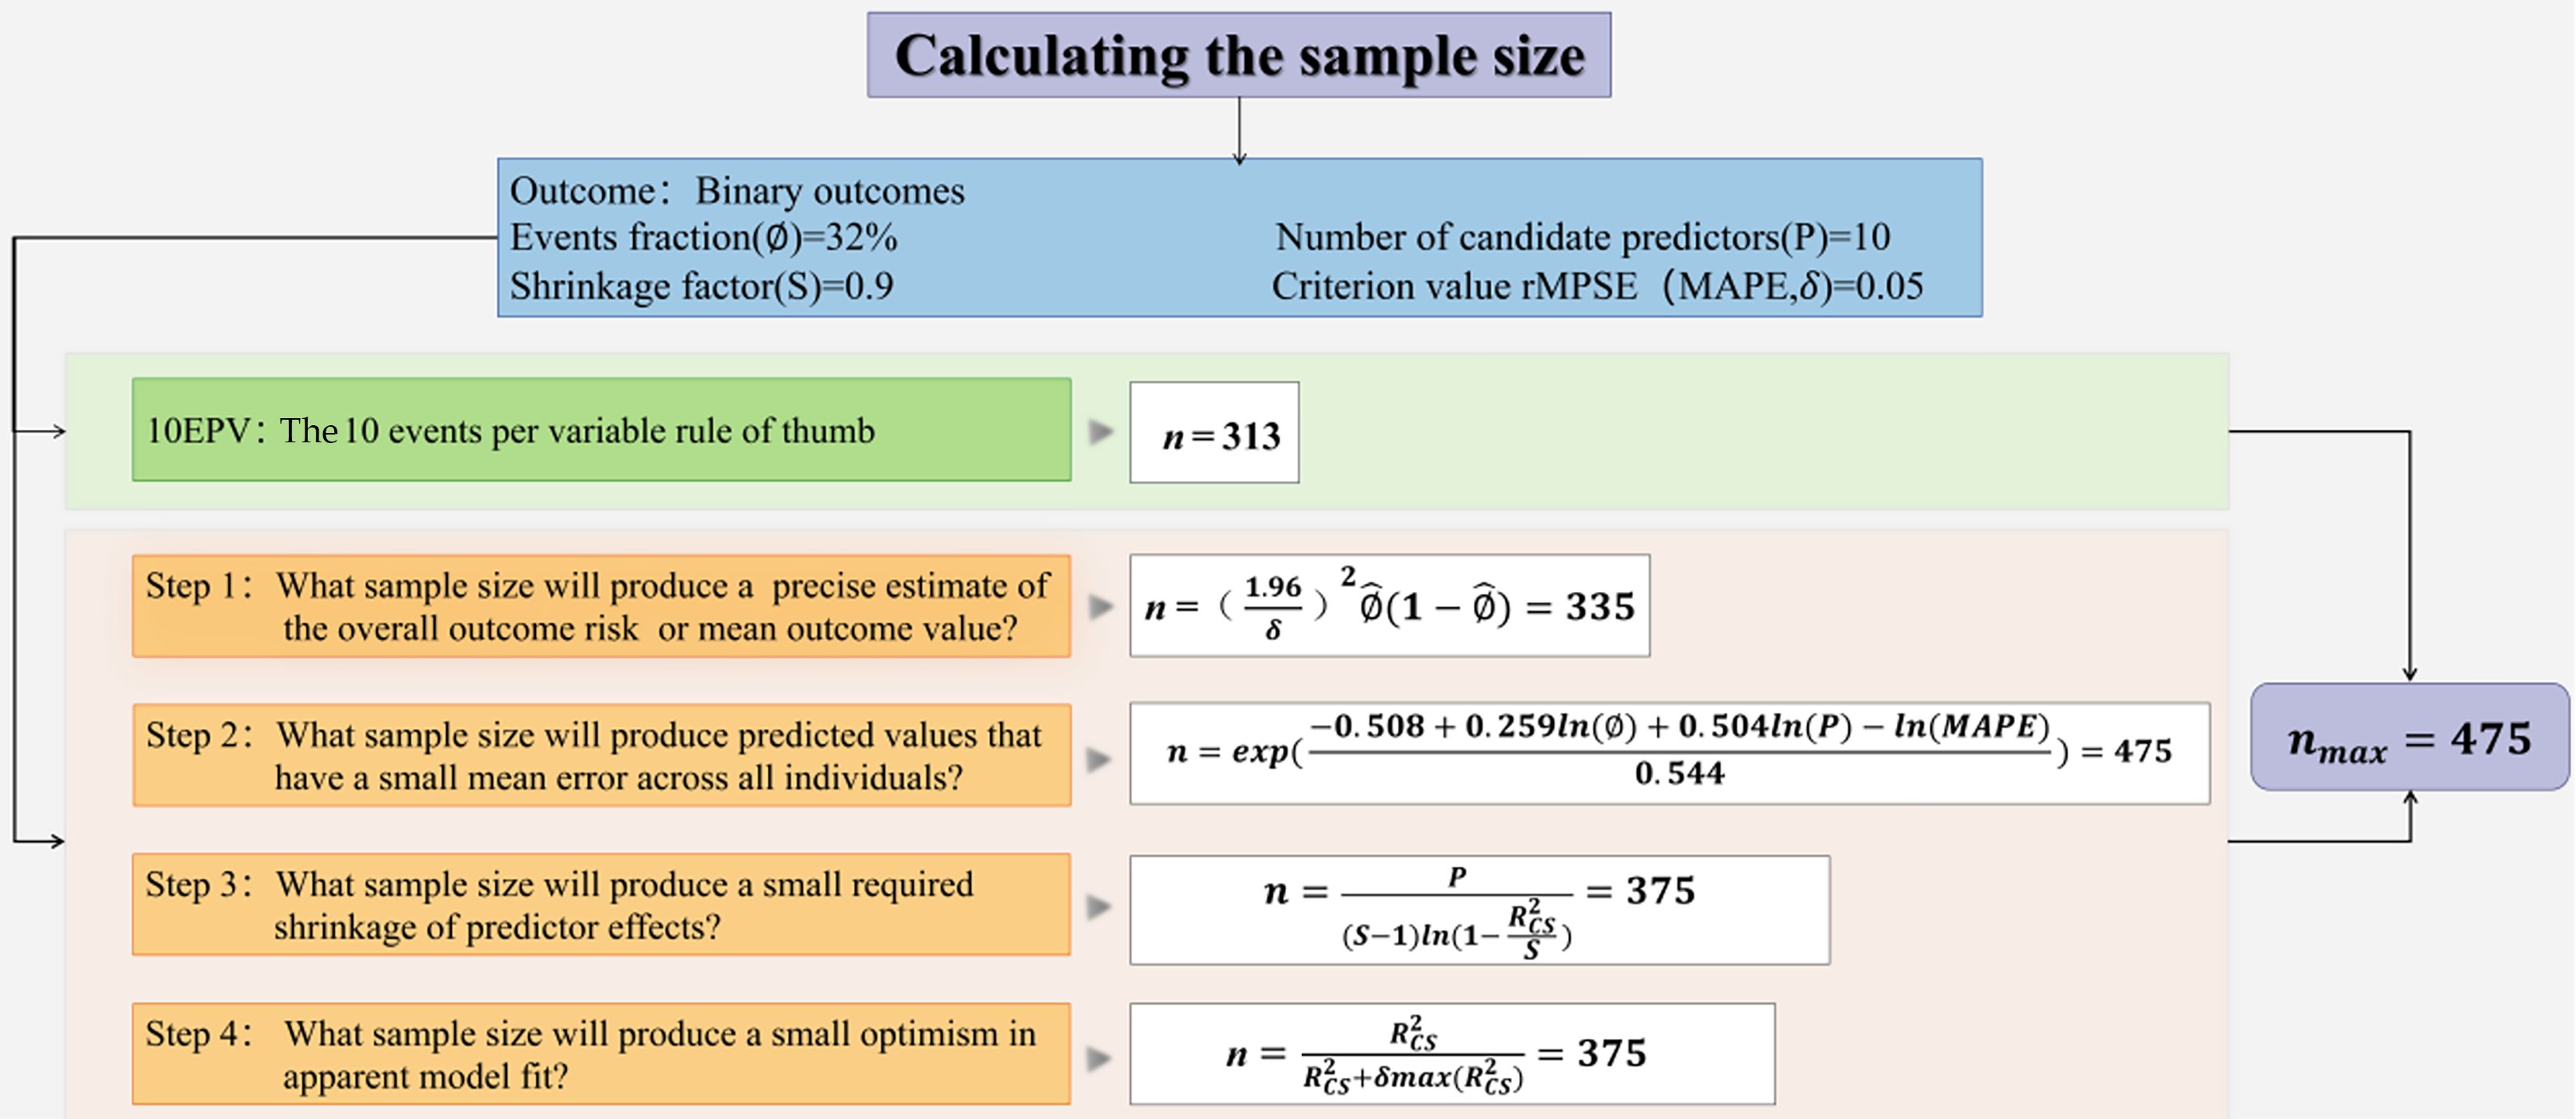
Figure 2 Sample size calculation flowchart.
rMPSE: Root mean squared prediction error; MPSE: Mean squared prediction error; EPV: Events per variable. In formula: Ø: Events fraction; δ: A margin of error, generally recommend < 0.05; P: Number of candidate predictors; S: Shrinkage factor; R2cs: A (conservative) value for the anticipated model performance is required, as defined by the Cox-Snell R squared statistic; MAPE: The mean absolute prediction error; n: The sample size.
- Citation: Liu YM, Du YY, Song Y, Xiong HT, Yu HB, Li BH, Cai L, Ma SS, Gao J, Zhang HY, Fang RY, Cai R, Zheng HG. Predicting chemotherapy-induced myelosuppression in colorectal cancer: An interpretable, machine learning-based nomogram. World J Gastroenterol 2025; 31(42): 112180
- URL: https://www.wjgnet.com/1007-9327/full/v31/i42/112180.htm
- DOI: https://dx.doi.org/10.3748/wjg.v31.i42.112180