
















©The Author(s) 2025.
World J Gastroenterol. Nov 7, 2025; 31(41): 111256
Published online Nov 7, 2025. doi: 10.3748/wjg.v31.i41.111256
Published online Nov 7, 2025. doi: 10.3748/wjg.v31.i41.111256
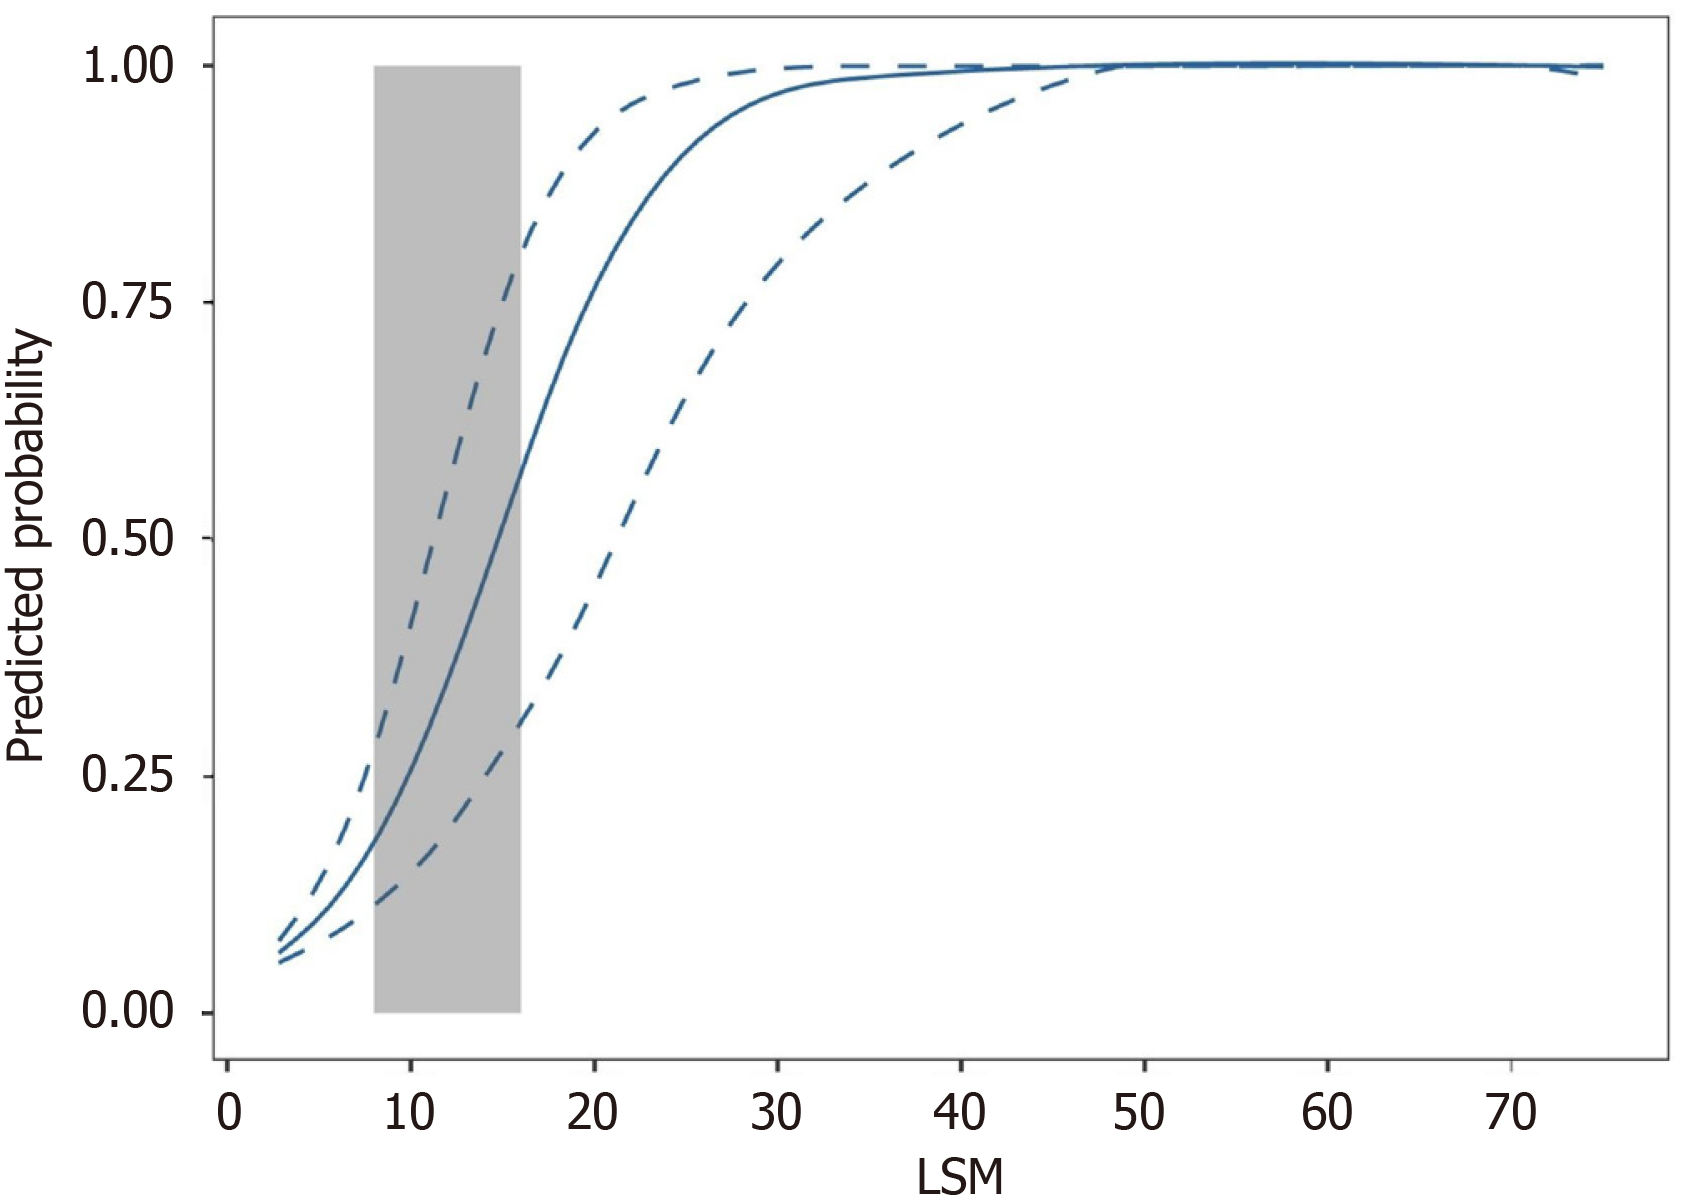
Figure 2 Logistic curve of the relationship between predicted probabilities of advanced fibrosis and liver stiffness measurement.
The grey area (8-16 kPa) highlights the portion of the curve in which vibration-controlled transient elastography may not be reliable in predicting advanced fibrosis. LSM: Liver stiffness measurement.
- Citation: Chen JL, Hou YX, Liu Y, Jiang YY, Wang XB. Real-world performance of transient elastography in assessing advanced fibrosis in Chinese patients with primary biliary cholangitis. World J Gastroenterol 2025; 31(41): 111256
- URL: https://www.wjgnet.com/1007-9327/full/v31/i41/111256.htm
- DOI: https://dx.doi.org/10.3748/wjg.v31.i41.111256