
















©The Author(s) 2025.
World J Gastroenterol. Nov 7, 2025; 31(41): 111184
Published online Nov 7, 2025. doi: 10.3748/wjg.v31.i41.111184
Published online Nov 7, 2025. doi: 10.3748/wjg.v31.i41.111184
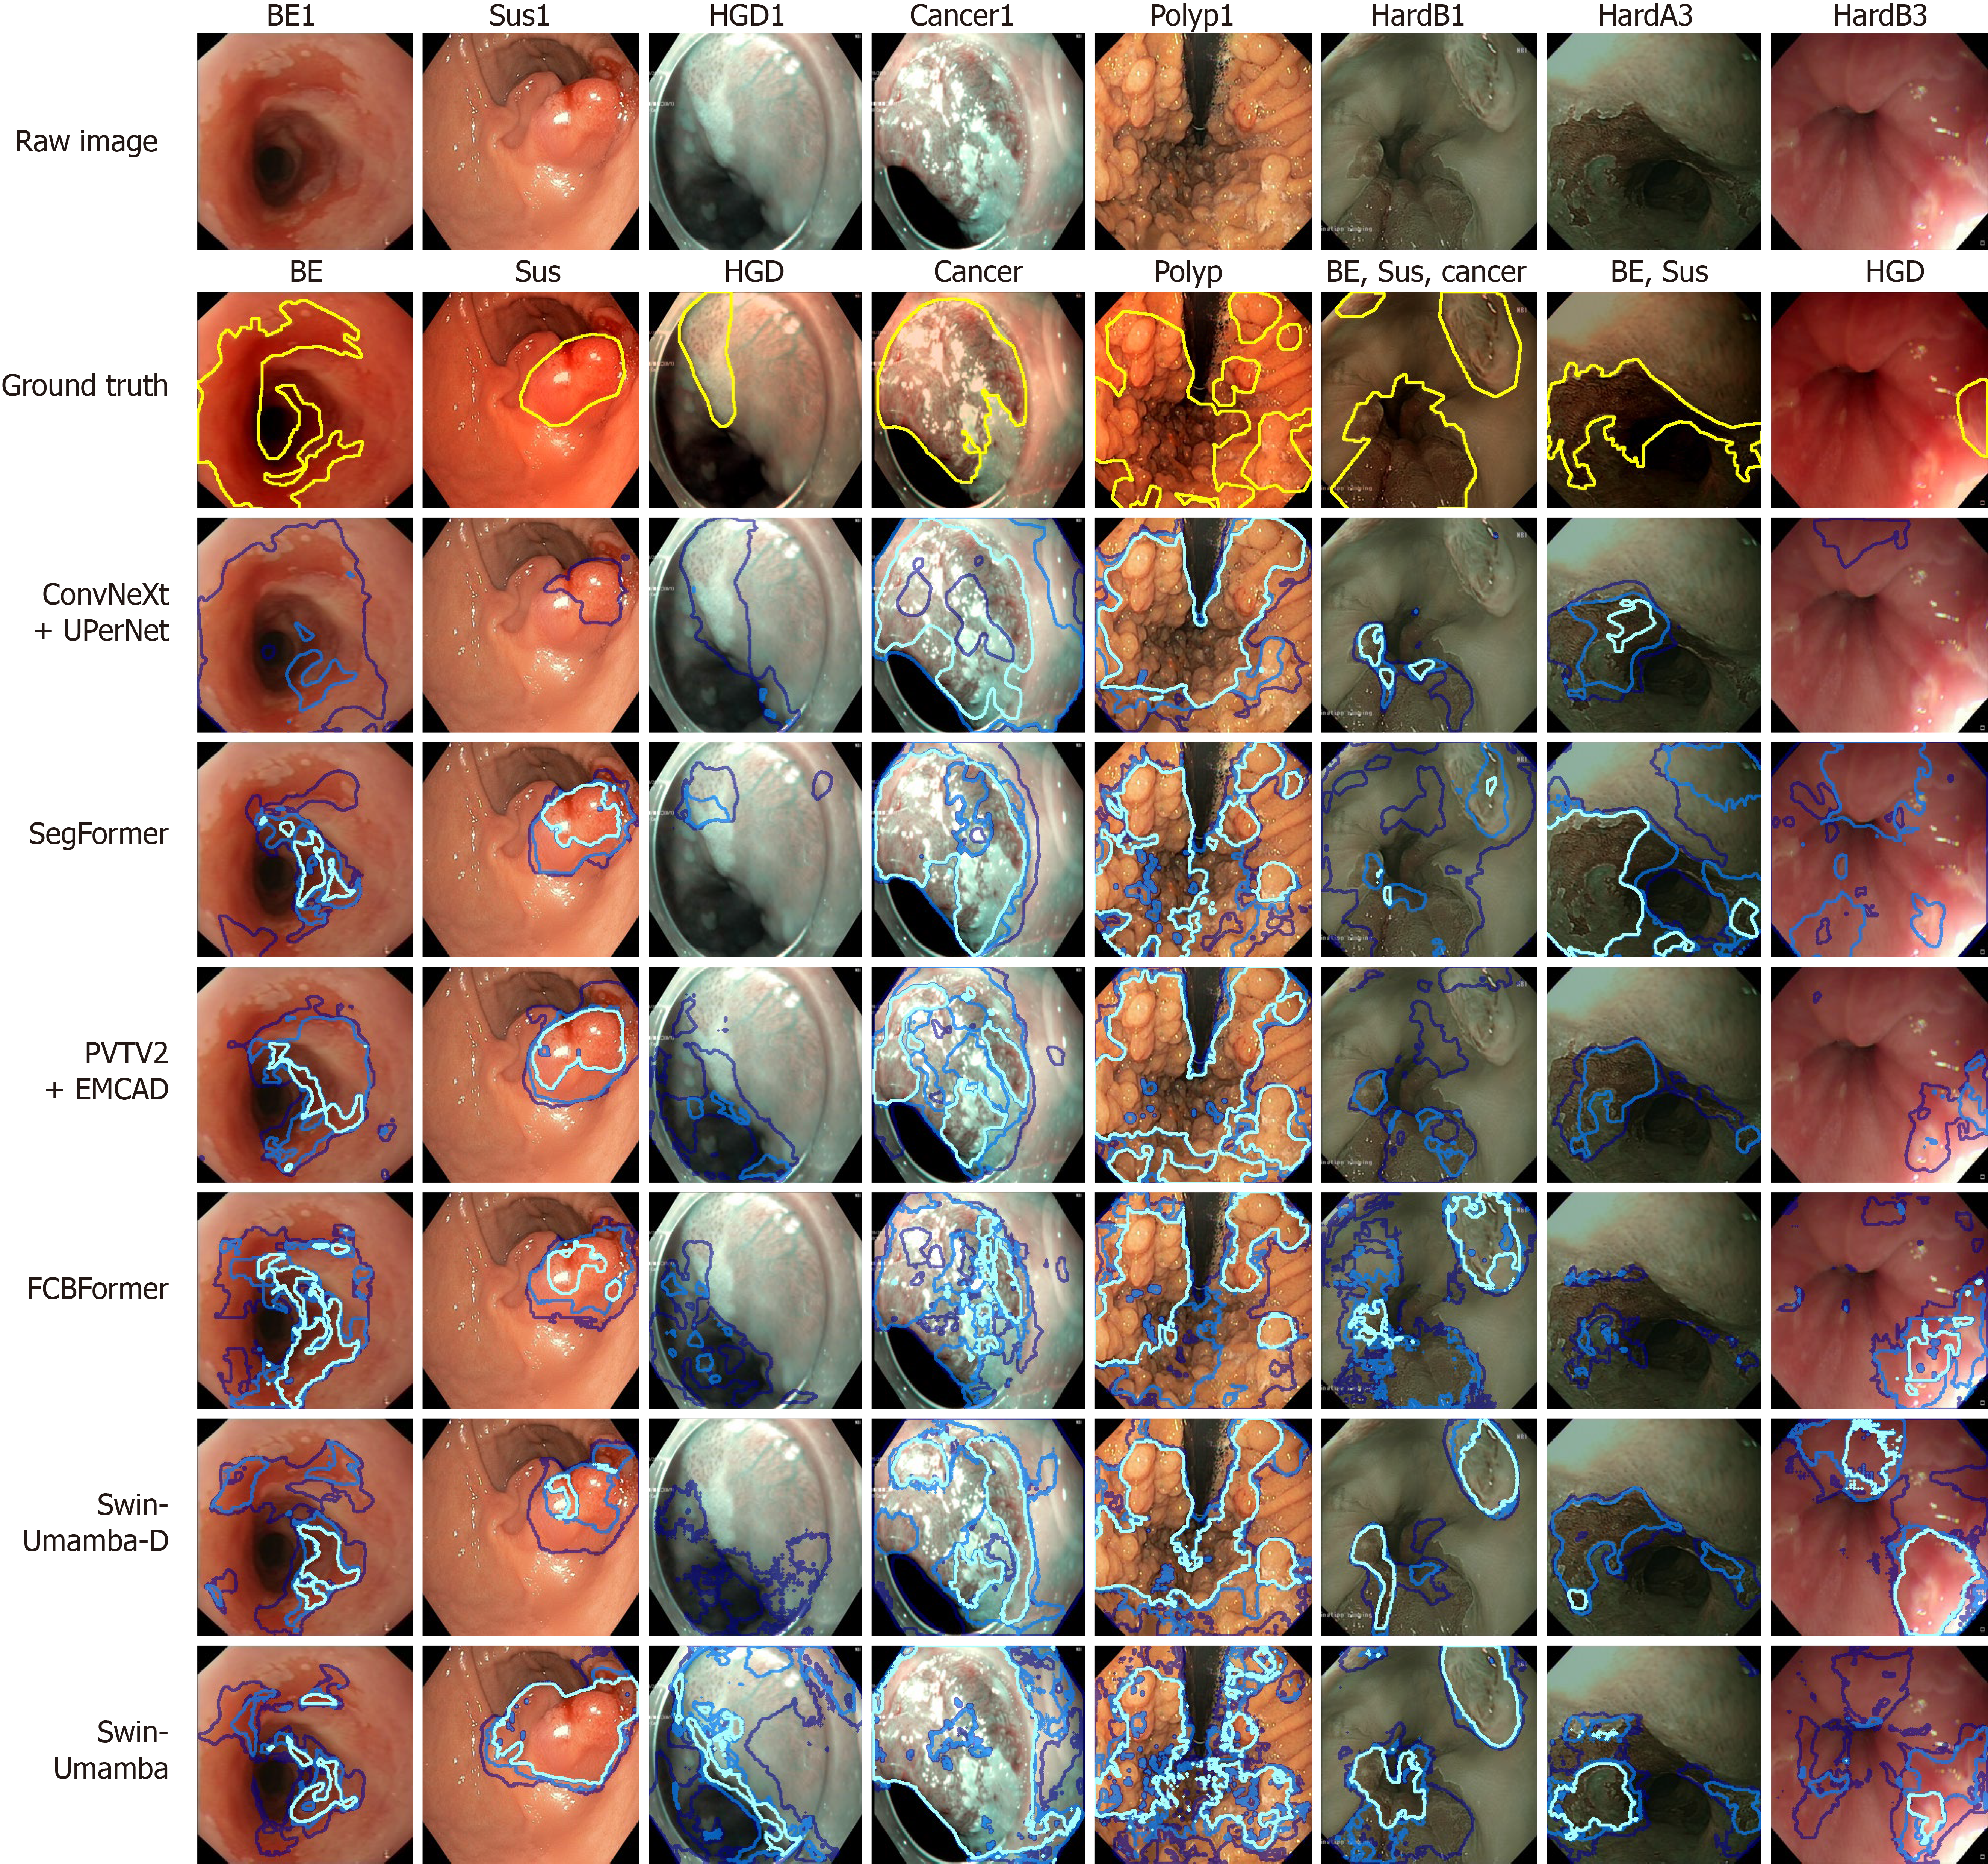
Figure 9 Examples of segmentation output visualizations of different models for the cross-dataset evaluation.
Light blue: Fully overlapping regions; Medium blue: Two-map overlaps; Dark blue: Single-map regions; Yellow: Ground truth lesions; HardB: Hard examples from EDD2020 dataset; PVTV2: Pyramid vision transformer v2; Sus: Suspicious precancerous lesions; EMCAD: Efficient multi-scale convolutional decoding; HGD: High-grade dysplasia; BE: Barrett’s esophagus.
- Citation: Chan IN, Wong PK, Yan T, Hu YY, Chan CI, Qin YY, Wong CH, Chan IW, Lam IH, Wong SH, Li Z, Gao S, Yu HH, Yao L, Zhao BL, Hu Y. Assessing deep learning models for multi-class upper endoscopic disease segmentation: A comprehensive comparative study. World J Gastroenterol 2025; 31(41): 111184
- URL: https://www.wjgnet.com/1007-9327/full/v31/i41/111184.htm
- DOI: https://dx.doi.org/10.3748/wjg.v31.i41.111184