
















©The Author(s) 2025.
World J Gastroenterol. Oct 28, 2025; 31(40): 112637
Published online Oct 28, 2025. doi: 10.3748/wjg.v31.i40.112637
Published online Oct 28, 2025. doi: 10.3748/wjg.v31.i40.112637
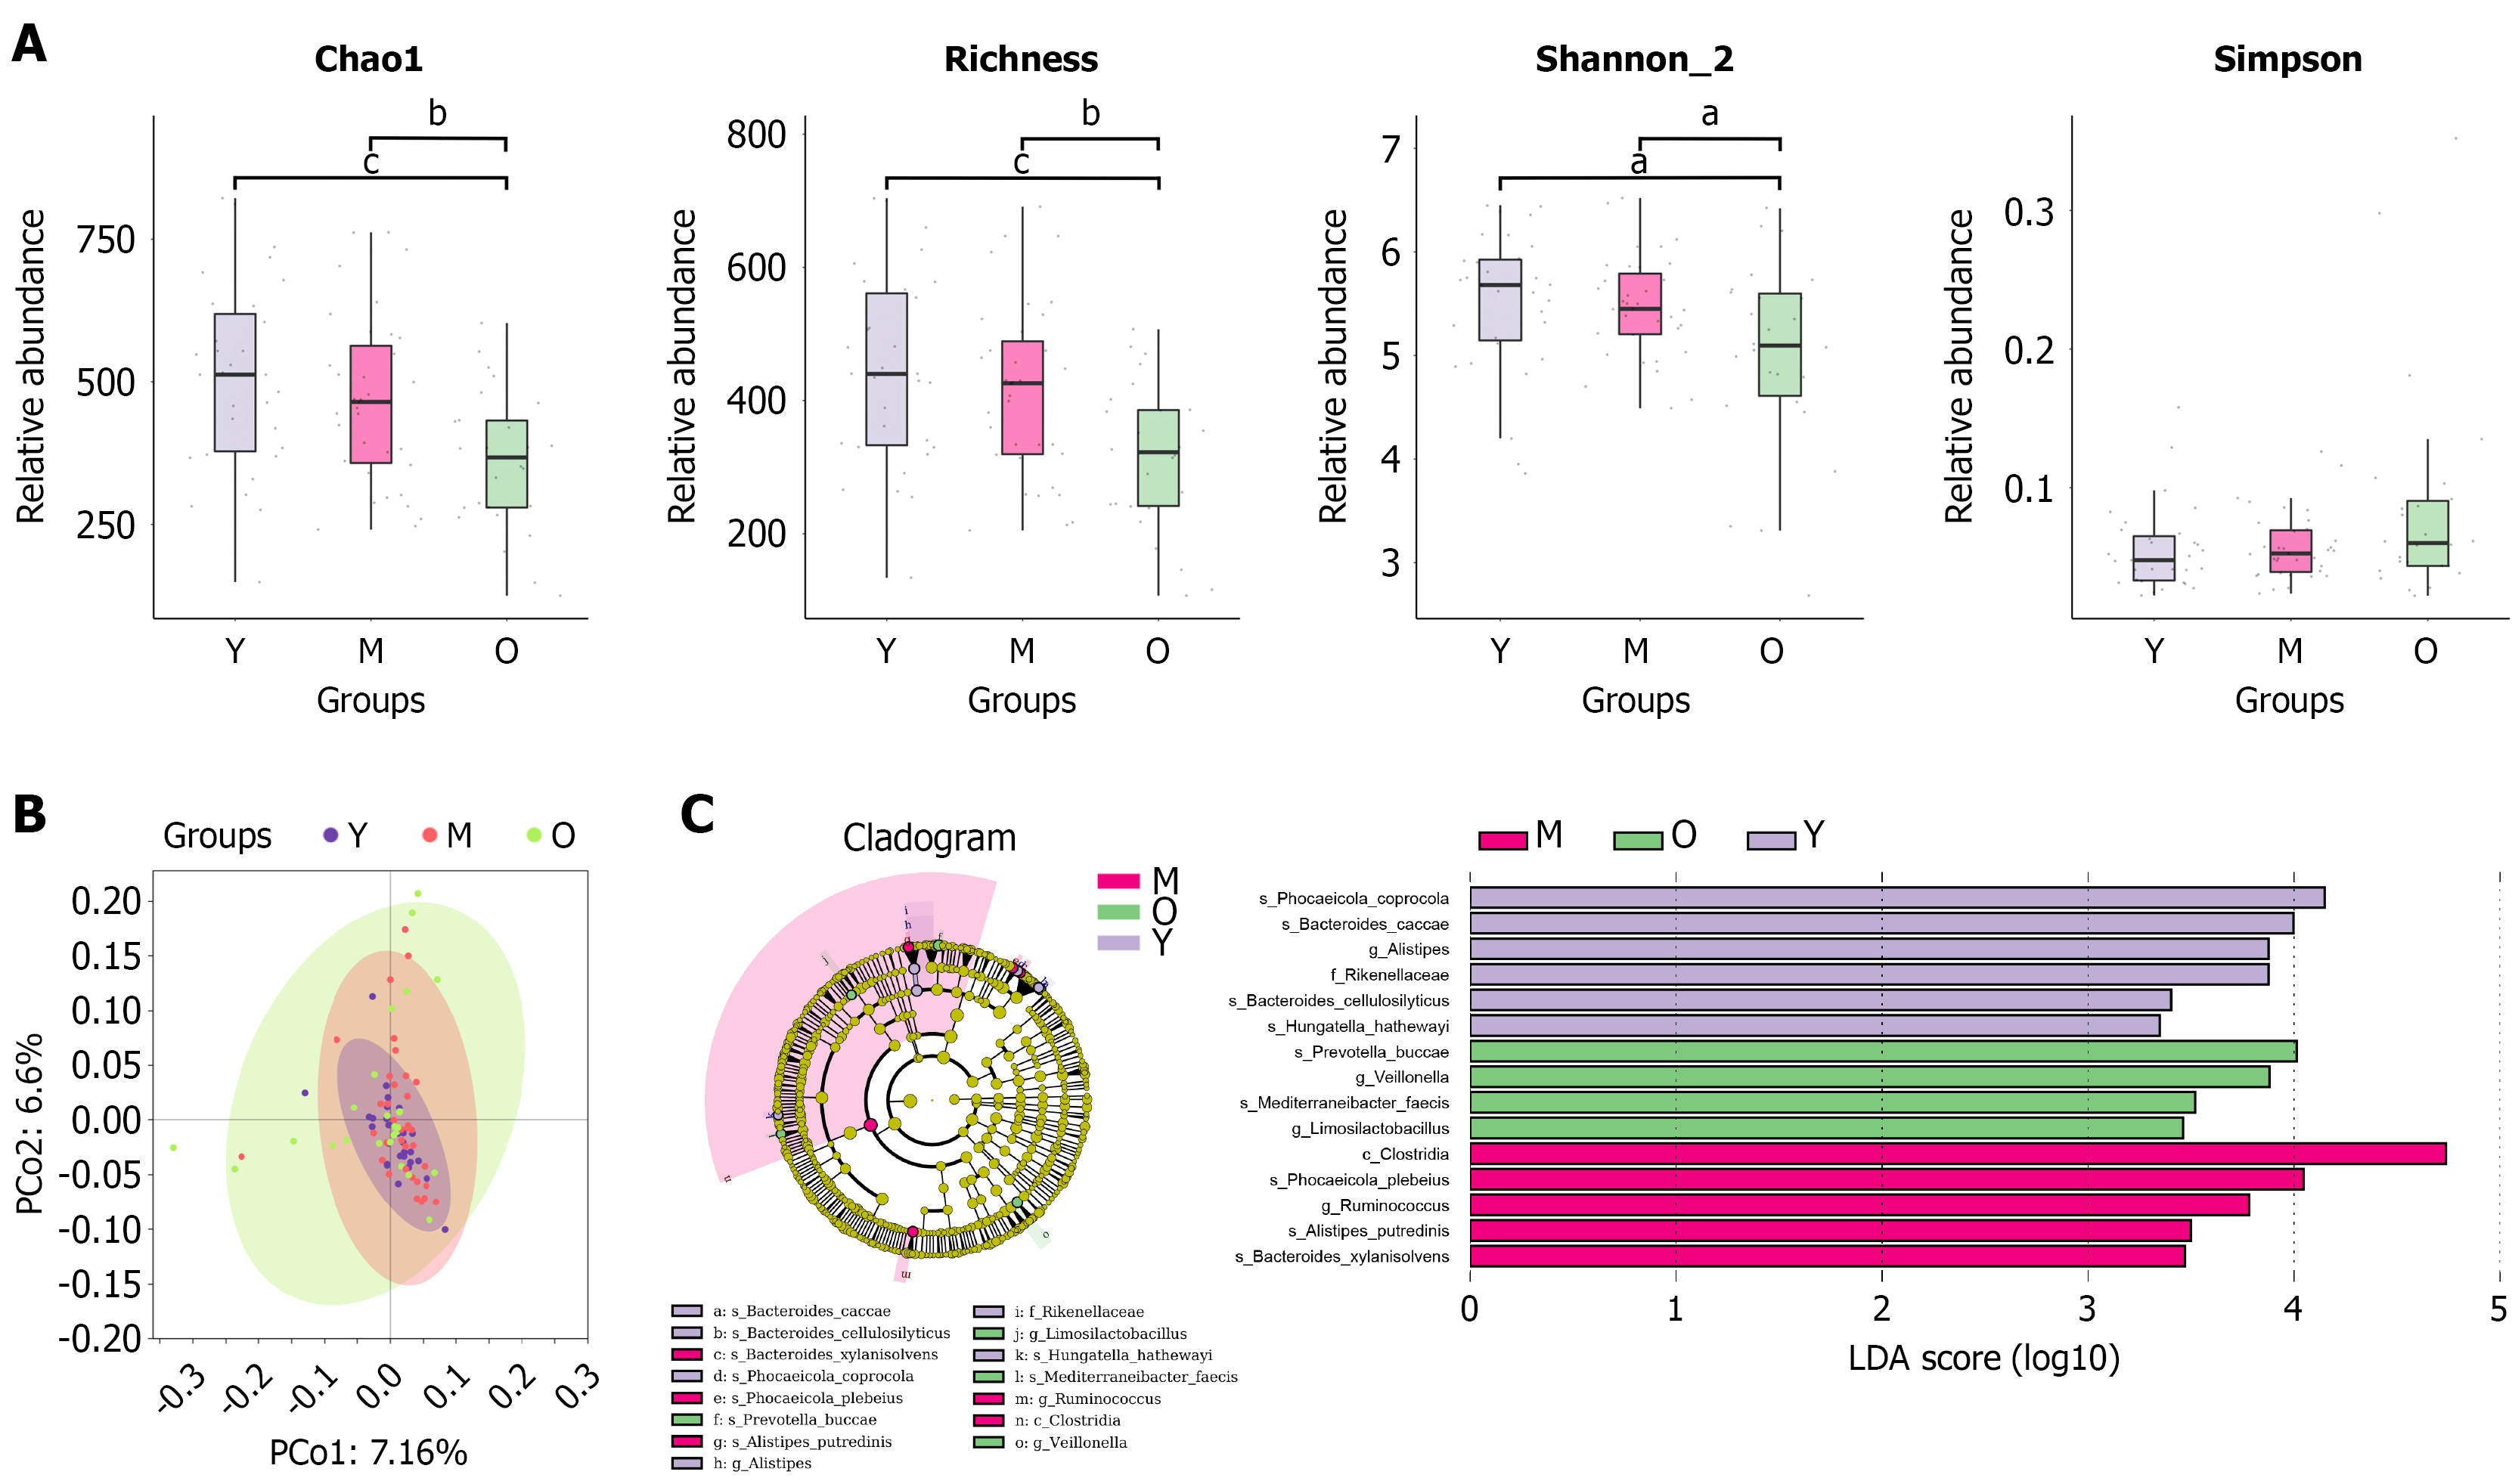
Figure 2 Comparison of gut microbiota profiles among different age groups.
A: Comparison of α-diversity among different age groups, including Chao1, richness, Shannon, and Simpson indices; B: Β-diversity analysis of gut microbiota composition; C: Linear discriminant analysis effect size analysis identifying taxa with significantly different relative abundances among groups. aP < 0.05. bP < 0.01. cP < 0.001. Y: Young; M: Middle-aged; O: Older; PCo: Principal co-ordinates; LDA: Linear discriminant analysis.
- Citation: Zhu HT, Wang HF, Zhang Q, Bai JF, Wang M, Du SY, Zhang YL. Comprehensive microbial and clinical profiling of functional constipation: A stratified comparative study of age and constipation subtype. World J Gastroenterol 2025; 31(40): 112637
- URL: https://www.wjgnet.com/1007-9327/full/v31/i40/112637.htm
- DOI: https://dx.doi.org/10.3748/wjg.v31.i40.112637