
















©The Author(s) 2025.
World J Gastroenterol. Oct 28, 2025; 31(40): 112033
Published online Oct 28, 2025. doi: 10.3748/wjg.v31.i40.112033
Published online Oct 28, 2025. doi: 10.3748/wjg.v31.i40.112033
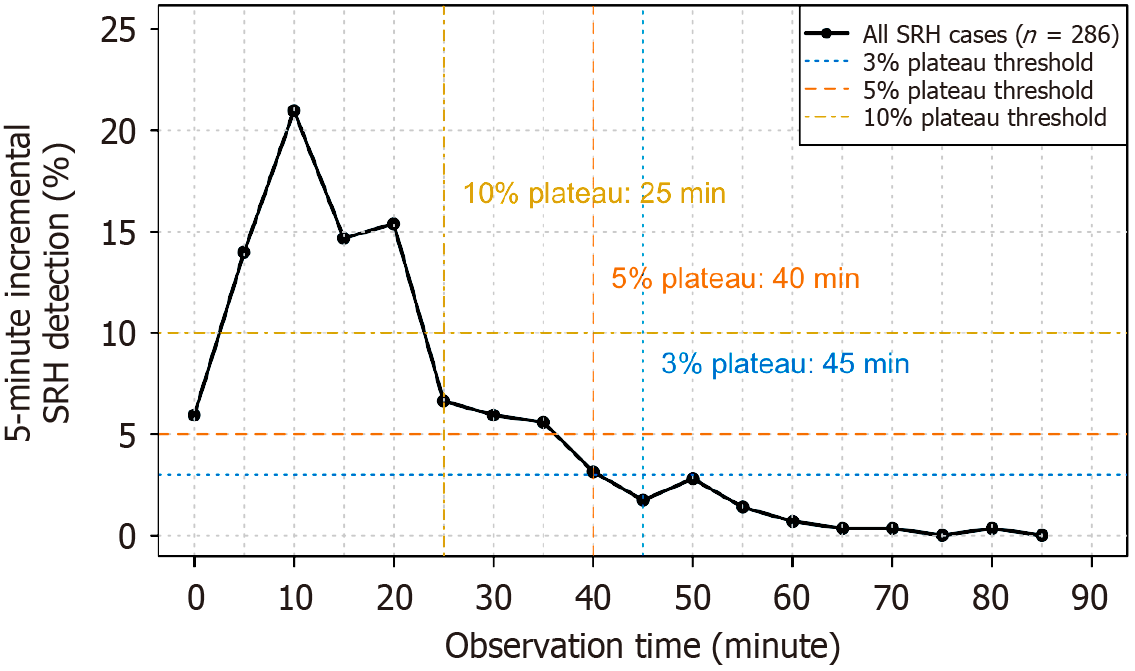
Figure 7 Sensitivity analysis of incremental stigmata of recent hemorrhage detection using alternative plateau thresholds.
The horizontal dashed lines indicate the thresholds of 3%, 5%, and 10%, and the vertical dashed lines mark the corresponding plateau times. SRH: Stigmata of recent hemorrhage.
- Citation: Ichita C, Goto T, Nishino T, Nakaya S, Shimizu S. Minimum colonoscopy observation time for colonic diverticular bleeding: A new benchmark based on the 5% plateau time. World J Gastroenterol 2025; 31(40): 112033
- URL: https://www.wjgnet.com/1007-9327/full/v31/i40/112033.htm
- DOI: https://dx.doi.org/10.3748/wjg.v31.i40.112033