
















©The Author(s) 2025.
World J Gastroenterol. Oct 28, 2025; 31(40): 111406
Published online Oct 28, 2025. doi: 10.3748/wjg.v31.i40.111406
Published online Oct 28, 2025. doi: 10.3748/wjg.v31.i40.111406
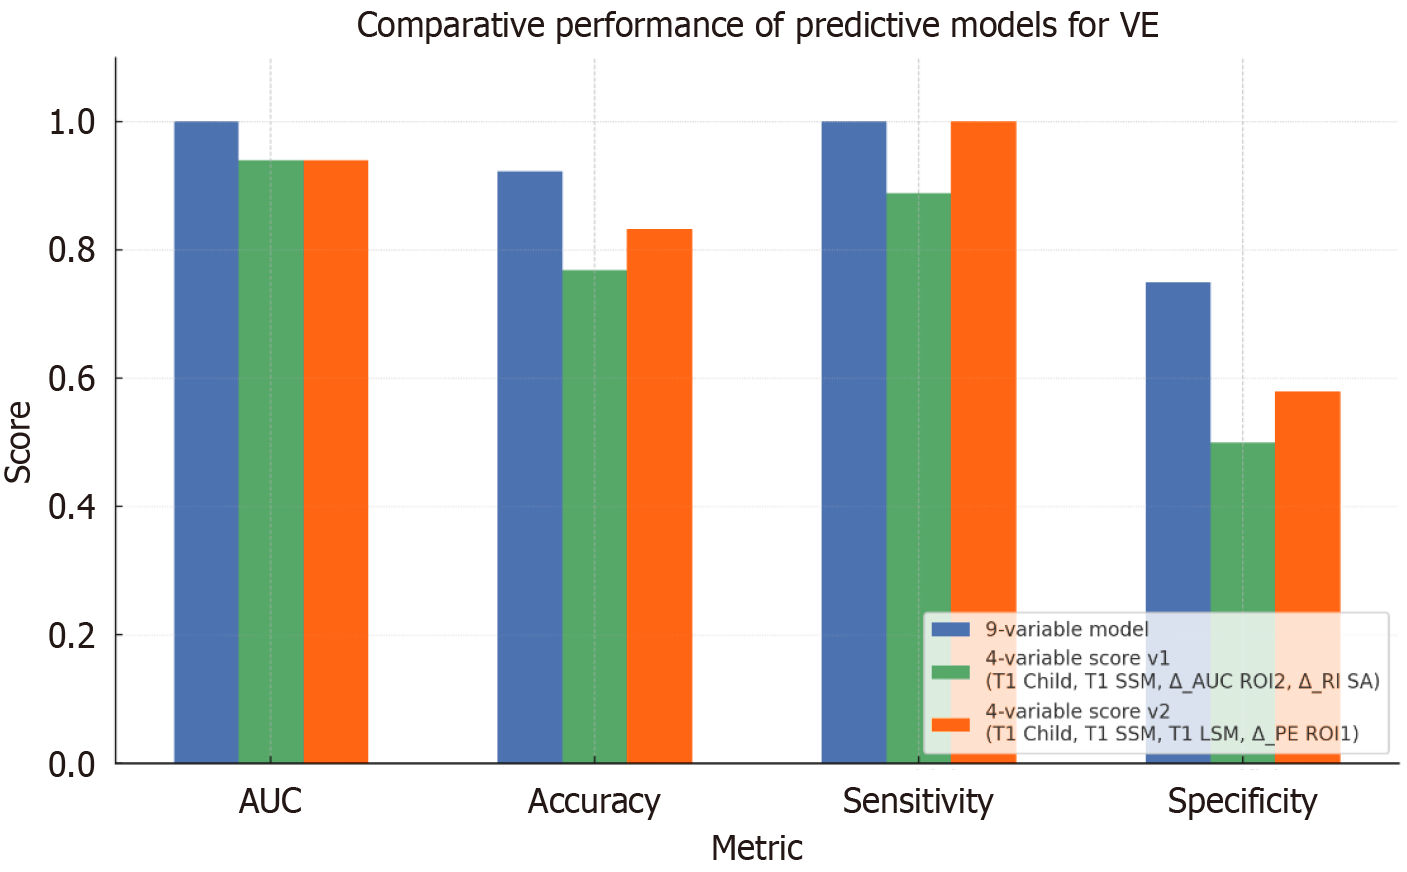
Figure 4 Comparative performance of the three predictive models for variceal eradication.
This bar plot illustrates the accuracy, area under the curve, sensitivity, and specificity of three logistic models developed to predict variceal eradication. VE: Variceal eradication; AUC: Area under the curve; LSM: Liver stiffness measurement; SSM: Spleen stiffness measurement; ΔAUC ROI2: Variations between T1 and T0 in area under the curve of portal vein; ΔRI SA: Variations between T1 and T0 of splenic artery resistivity index; ΔPE ROI1: Variations between T1 and T0 in peak enhancement of liver parenchyma.
- Citation: Ainora ME, Borriello R, Pecere S, Paratore M, Galasso L, Calvez V, Esposto G, Mignini I, Barbaro F, Del Vecchio LE, Ponziani FR, Annicchiarico BE, Garcovich M, Riccardi L, Pompili M, Spada C, Gasbarrini A, Zocco MA. Multiparametric ultrasound for the prediction of the short-term outcome after esophageal varices band ligation. World J Gastroenterol 2025; 31(40): 111406
- URL: https://www.wjgnet.com/1007-9327/full/v31/i40/111406.htm
- DOI: https://dx.doi.org/10.3748/wjg.v31.i40.111406