
















©The Author(s) 2025.
World J Gastroenterol. Oct 14, 2025; 31(38): 111364
Published online Oct 14, 2025. doi: 10.3748/wjg.v31.i38.111364
Published online Oct 14, 2025. doi: 10.3748/wjg.v31.i38.111364
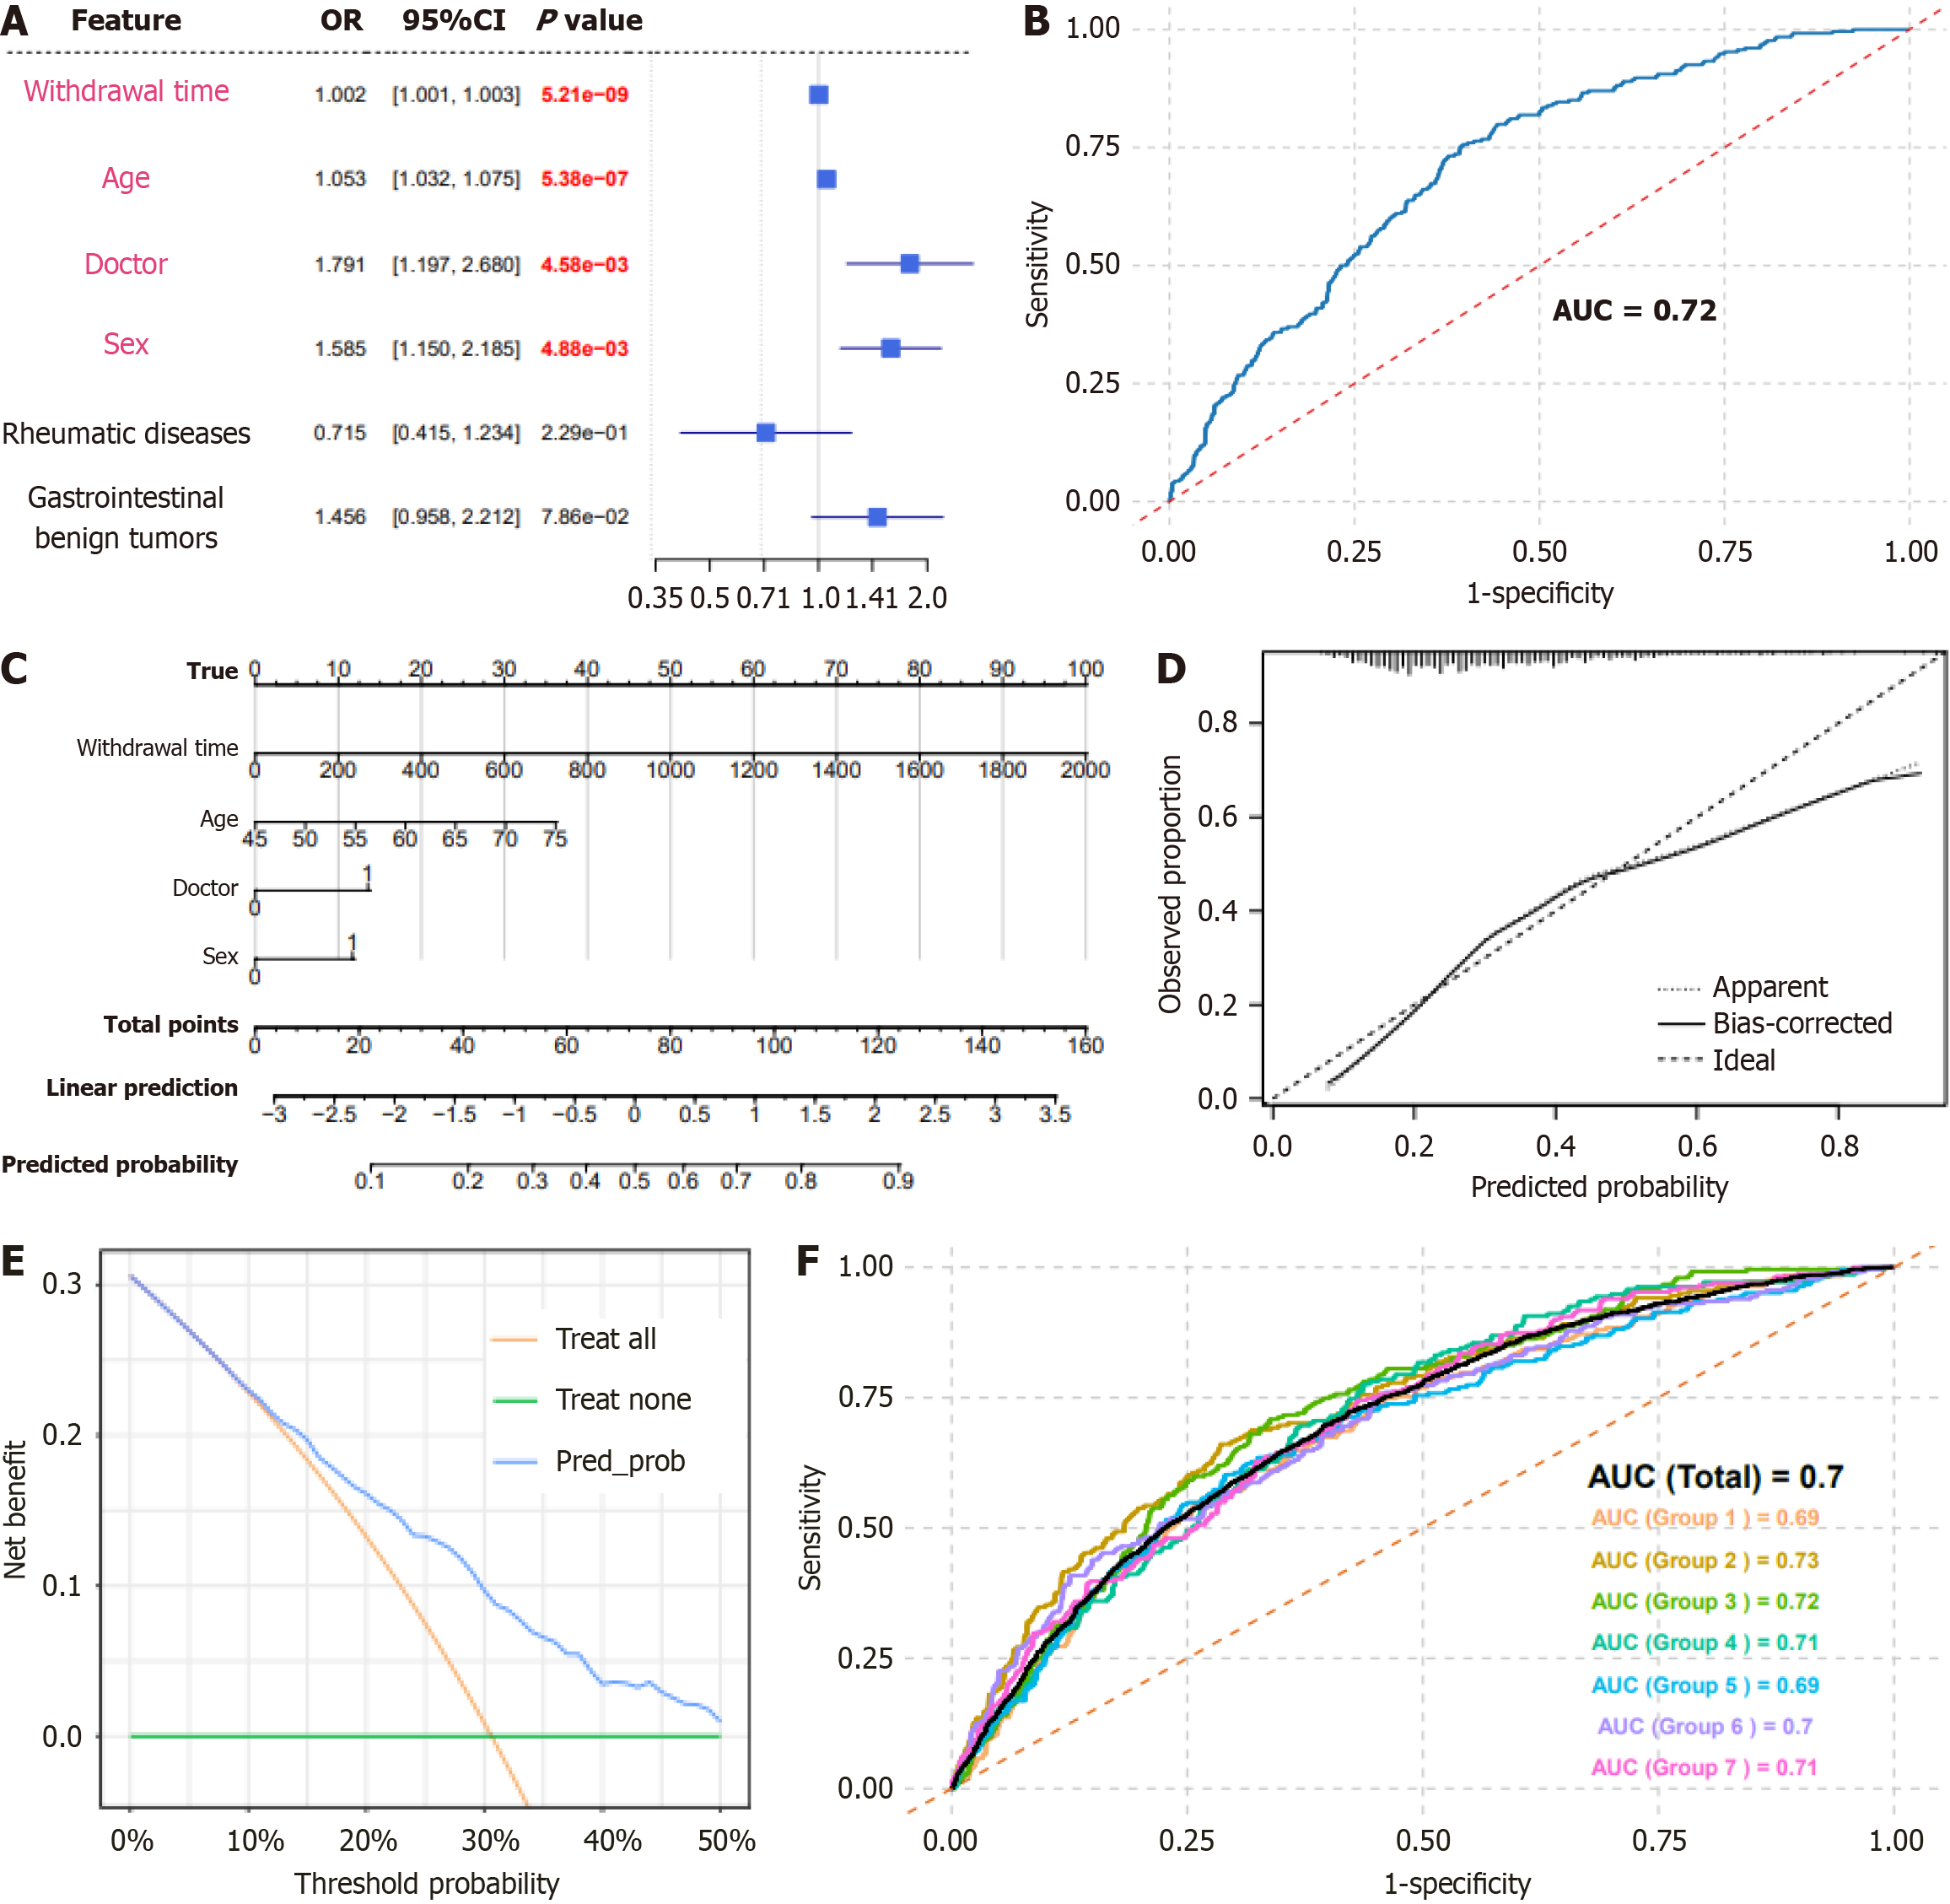
Figure 1 Development and valuation of the colorectal adenoma risk-prediction model.
A: Forest plot; B: Area under the curve (AUC) was 0.720; C: Nomogram; D: Calibration curve; E: Decision curve; F: Prospective validation in patients with colorectal adenomas yielded the following AUCs: Total = 0.700; Group 1 = 0.690; Group 2 = 0.730; Group 3 = 0.720; Group 4 = 0.710; Group 5 = 0.690; Group 6 = 0.700; Group 7 = 0.710. OR: Odds ratio; CI: Confidence interval; AUC: Area under the curve.
- Citation: Xu BX, Xu CZ, Zhang HY, Chen XJ, Wei BN, Yang C. Personalizing withdrawal time by insertion time to achieve target adenoma detection rate in colonoscopy. World J Gastroenterol 2025; 31(38): 111364
- URL: https://www.wjgnet.com/1007-9327/full/v31/i38/111364.htm
- DOI: https://dx.doi.org/10.3748/wjg.v31.i38.111364