
















©The Author(s) 2025.
World J Gastroenterol. Oct 7, 2025; 31(37): 111914
Published online Oct 7, 2025. doi: 10.3748/wjg.v31.i37.111914
Published online Oct 7, 2025. doi: 10.3748/wjg.v31.i37.111914
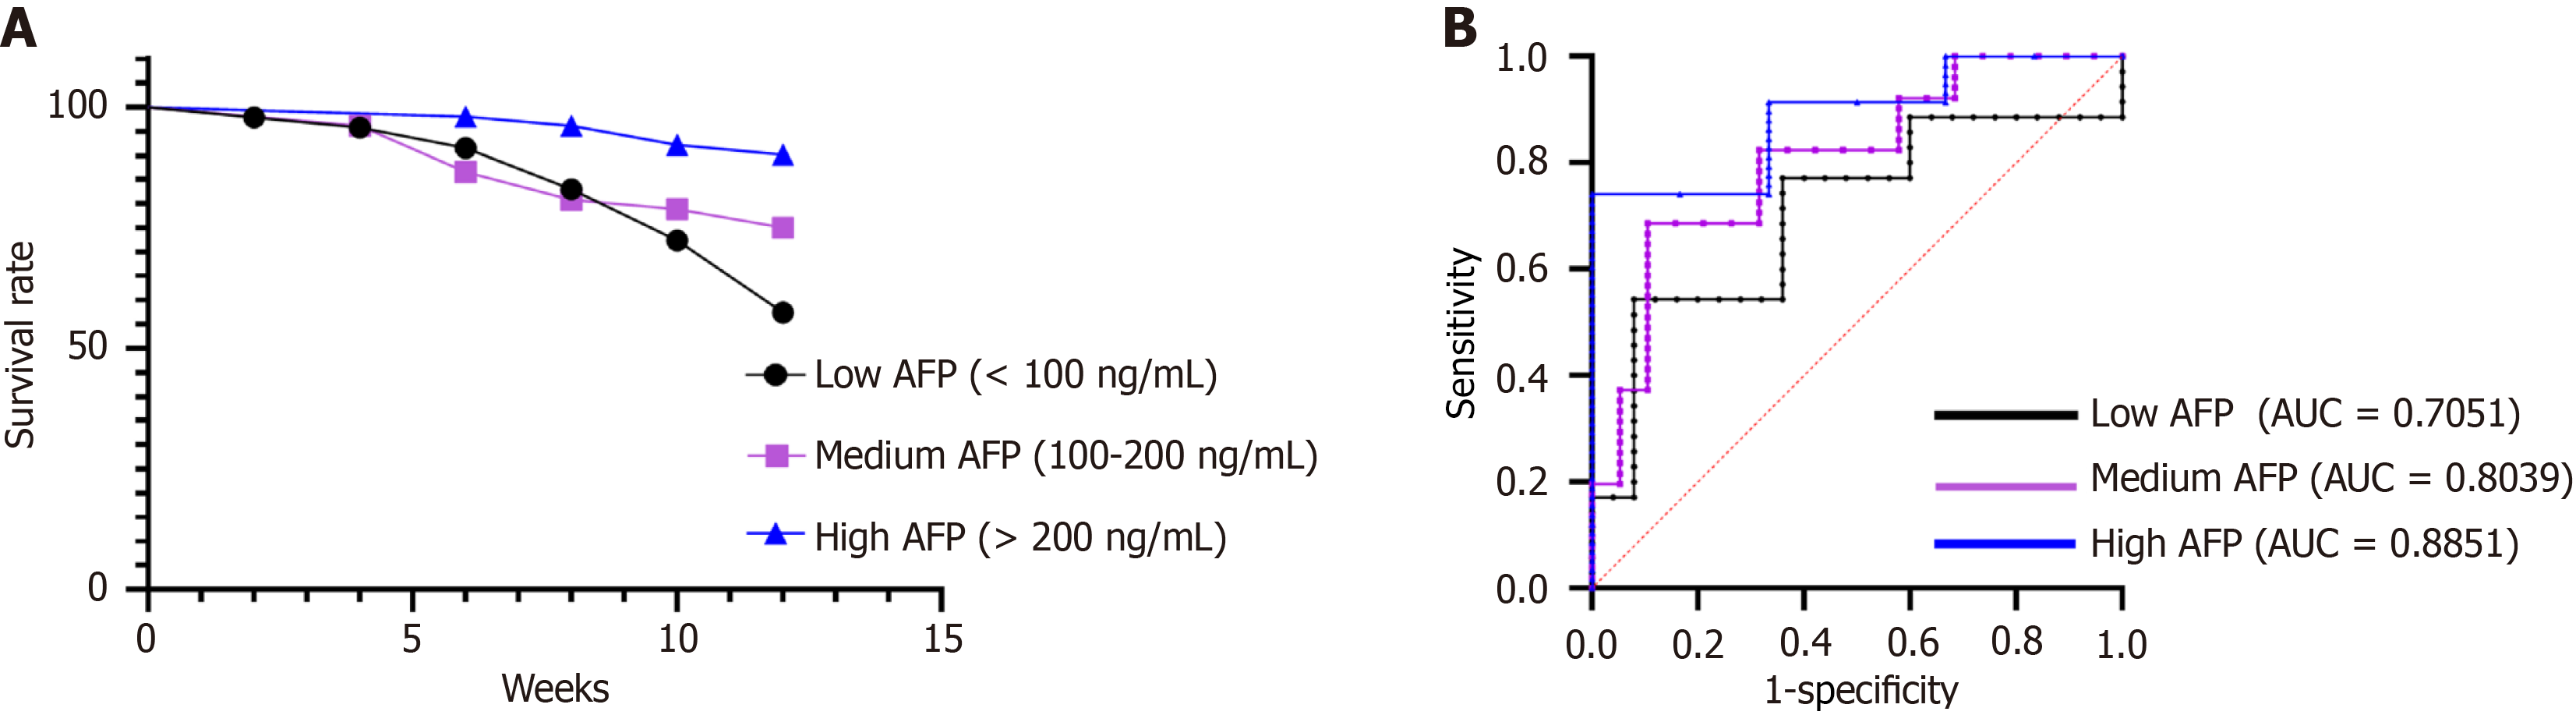
Figure 2 Kaplan-Meier estimates of 3-month survival and areas under the receiver operating characteristic curve calculated for each group at 3 months post-treatment.
A: This figure presents Kaplan-Meier survival curves illustrating the 3-month survival probabilities across the study groups stratified by serum alpha-fetoprotein (AFP) levels (low AFP group, medium AFP group, and high AFP group). The curves visualize differences in survival outcomes among the groups over the 3-month follow-up period; B: This figure displays receiver operating characteristic curves with corresponding areas under the curve values calculated for each group (low AFP group, medium AFP group, and high AFP group) at 3 months post-treatment. The areas under the curve values quantify the diagnostic performance of serum AFP levels in predicting outcomes at the 3-month time point. AFP: Alpha-fetoprotein; AUC: Areas under the curve.
- Citation: Guo WB, Wang LY, Guo XJ, Yang J, Li W, Shen FY, Li YT, Yang JH, Tai WL. Prognostic value of serum alpha-fetoprotein kinetics in liver failure on artificial liver support. World J Gastroenterol 2025; 31(37): 111914
- URL: https://www.wjgnet.com/1007-9327/full/v31/i37/111914.htm
- DOI: https://dx.doi.org/10.3748/wjg.v31.i37.111914