
















©The Author(s) 2025.
World J Gastroenterol. Oct 7, 2025; 31(37): 111038
Published online Oct 7, 2025. doi: 10.3748/wjg.v31.i37.111038
Published online Oct 7, 2025. doi: 10.3748/wjg.v31.i37.111038
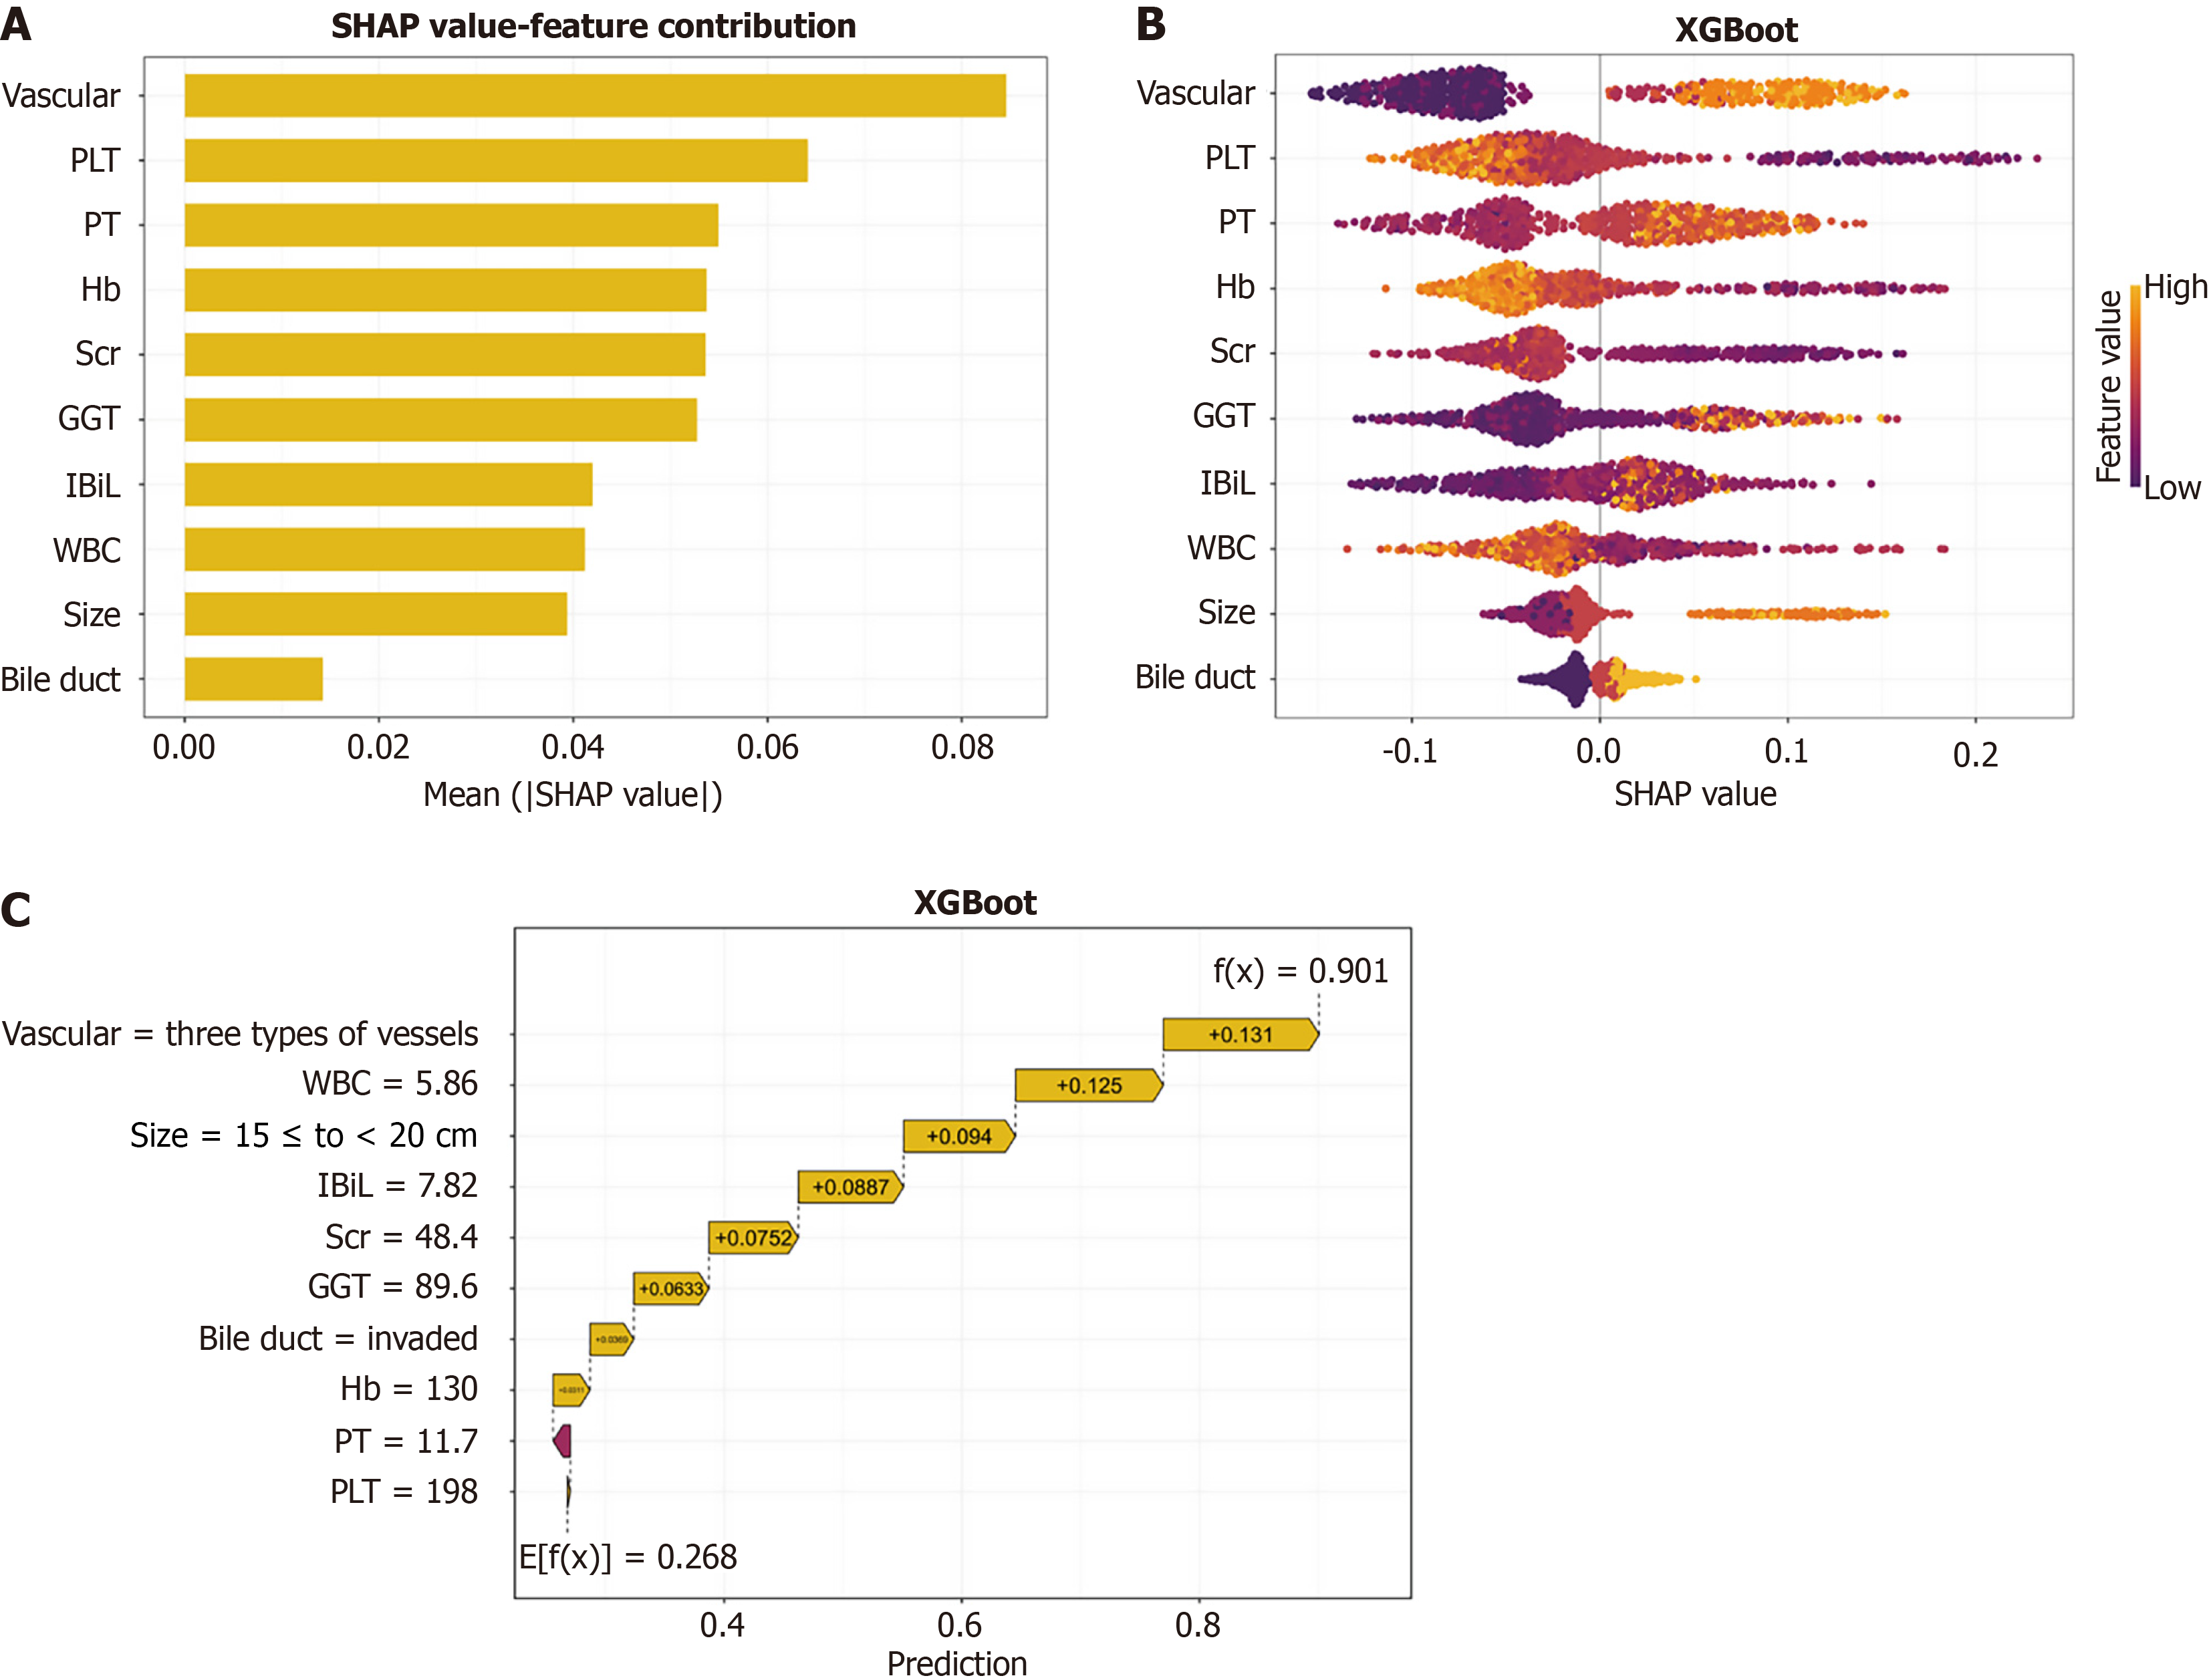
Figure 3 SHapley Additive exPlanations analysis for model interpretability.
A: SHapley Additive exPlanations (SHAP) summary bar chart, displaying the average SHAP values of features in descending order; B: SHAP summary dot plot, showing the direction and magnitude of each feature's influence on the model's prediction; C: SHAP waterfall chart for the 10th hepatic alveolar echinococcosis patient, illustrating the contribution of each feature to the prediction result. SHAP: SHapley Additive exPlanations; XGBoost: EXtreme Gradient Boosting; WBC: White blood cell count; PLT: Platelet count; Hb: Hemoglobin; IBil: Indirect bilirubin; GGT: γ-glutamyl transferase; Scr: Serum creatinine; PT: Prothrombin time.
- Citation: Zhu DL, Tulahong A, Liu C, Aierken A, Tan W, Ruze R, Yuan ZD, Yin L, Jiang TM, Lin RY, Shao YM, Aji T. Identification of key factors and explainability analysis for surgical decision-making in hepatic alveolar echinococcosis assisted by machine learning. World J Gastroenterol 2025; 31(37): 111038
- URL: https://www.wjgnet.com/1007-9327/full/v31/i37/111038.htm
- DOI: https://dx.doi.org/10.3748/wjg.v31.i37.111038