
















©The Author(s) 2025.
World J Gastroenterol. Sep 28, 2025; 31(36): 111293
Published online Sep 28, 2025. doi: 10.3748/wjg.v31.i36.111293
Published online Sep 28, 2025. doi: 10.3748/wjg.v31.i36.111293
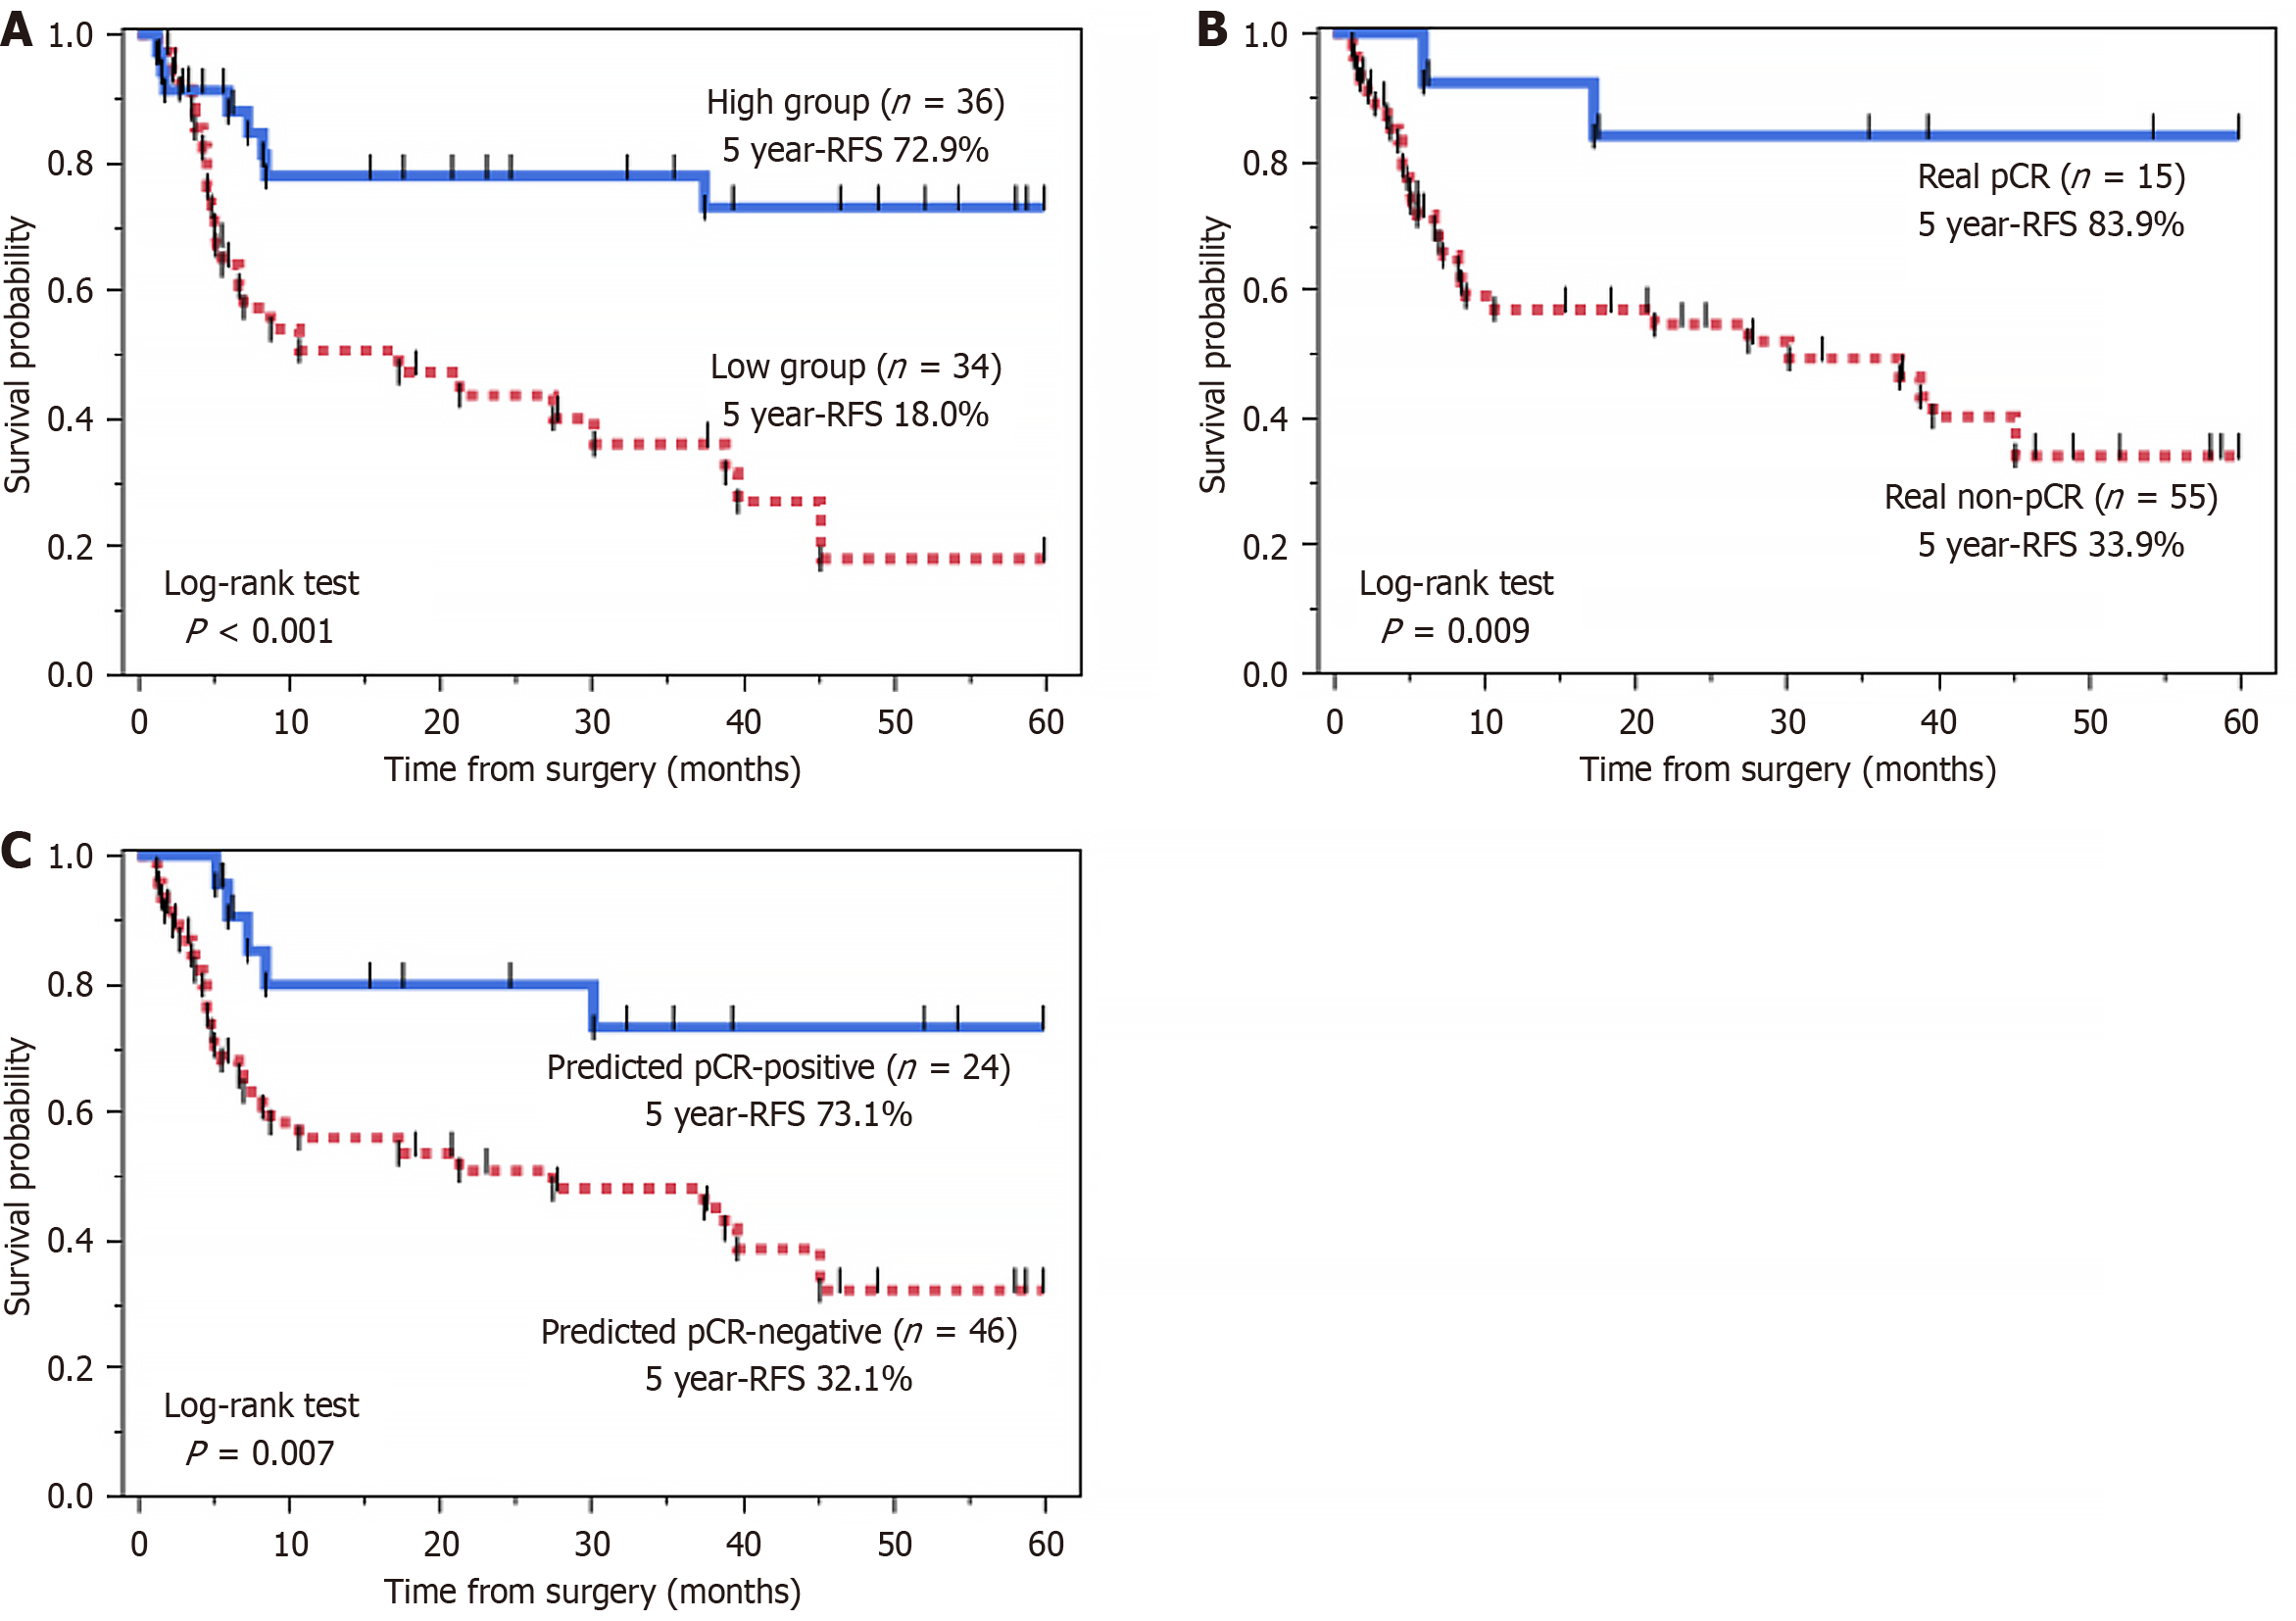
Figure 3 Kaplan-Meier curves for relapse-free survival.
A: Comparison of relapse-free survival (RFS) based on pre-treatment gray-level co-occurrence matrix entropy (b = 1000 second/mm²). The high entropy group (n = 36) showed significantly better RFS than the low entropy group (n = 34) (5-year RFS: 72.9% vs 18.0%, P < 0.001); B: Comparison of RFS based on actual pathological complete response (pCR) status. The real pCR group (n = 15) had significantly better RFS than the real non-pCR group (n = 55) (5-year RFS: 83.9% vs 33.9%, P = 0.009); C: Comparison of RFS based on the artificial intelligence model’s prediction. The predicted pCR-positive group (n = 24) demonstrated significantly better RFS than the predicted pCR-negative group (n = 46) (5-year RFS: 73.1% vs 32.1%, P = 0.007). RFS: Relapse-free survival; pCR: Pathological complete response.
- Citation: Hirata A, Hayano K, Tochigi T, Kurata Y, Shiraishi T, Sekino N, Nakano A, Matsumoto Y, Toyozumi T, Uesato M, Ohira G. Predicting pathological complete response to chemoradiotherapy using artificial intelligence-based magnetic resonance imaging radiomics in esophageal squamous cell carcinoma. World J Gastroenterol 2025; 31(36): 111293
- URL: https://www.wjgnet.com/1007-9327/full/v31/i36/111293.htm
- DOI: https://dx.doi.org/10.3748/wjg.v31.i36.111293