
















©The Author(s) 2025.
World J Gastroenterol. Sep 28, 2025; 31(36): 111293
Published online Sep 28, 2025. doi: 10.3748/wjg.v31.i36.111293
Published online Sep 28, 2025. doi: 10.3748/wjg.v31.i36.111293
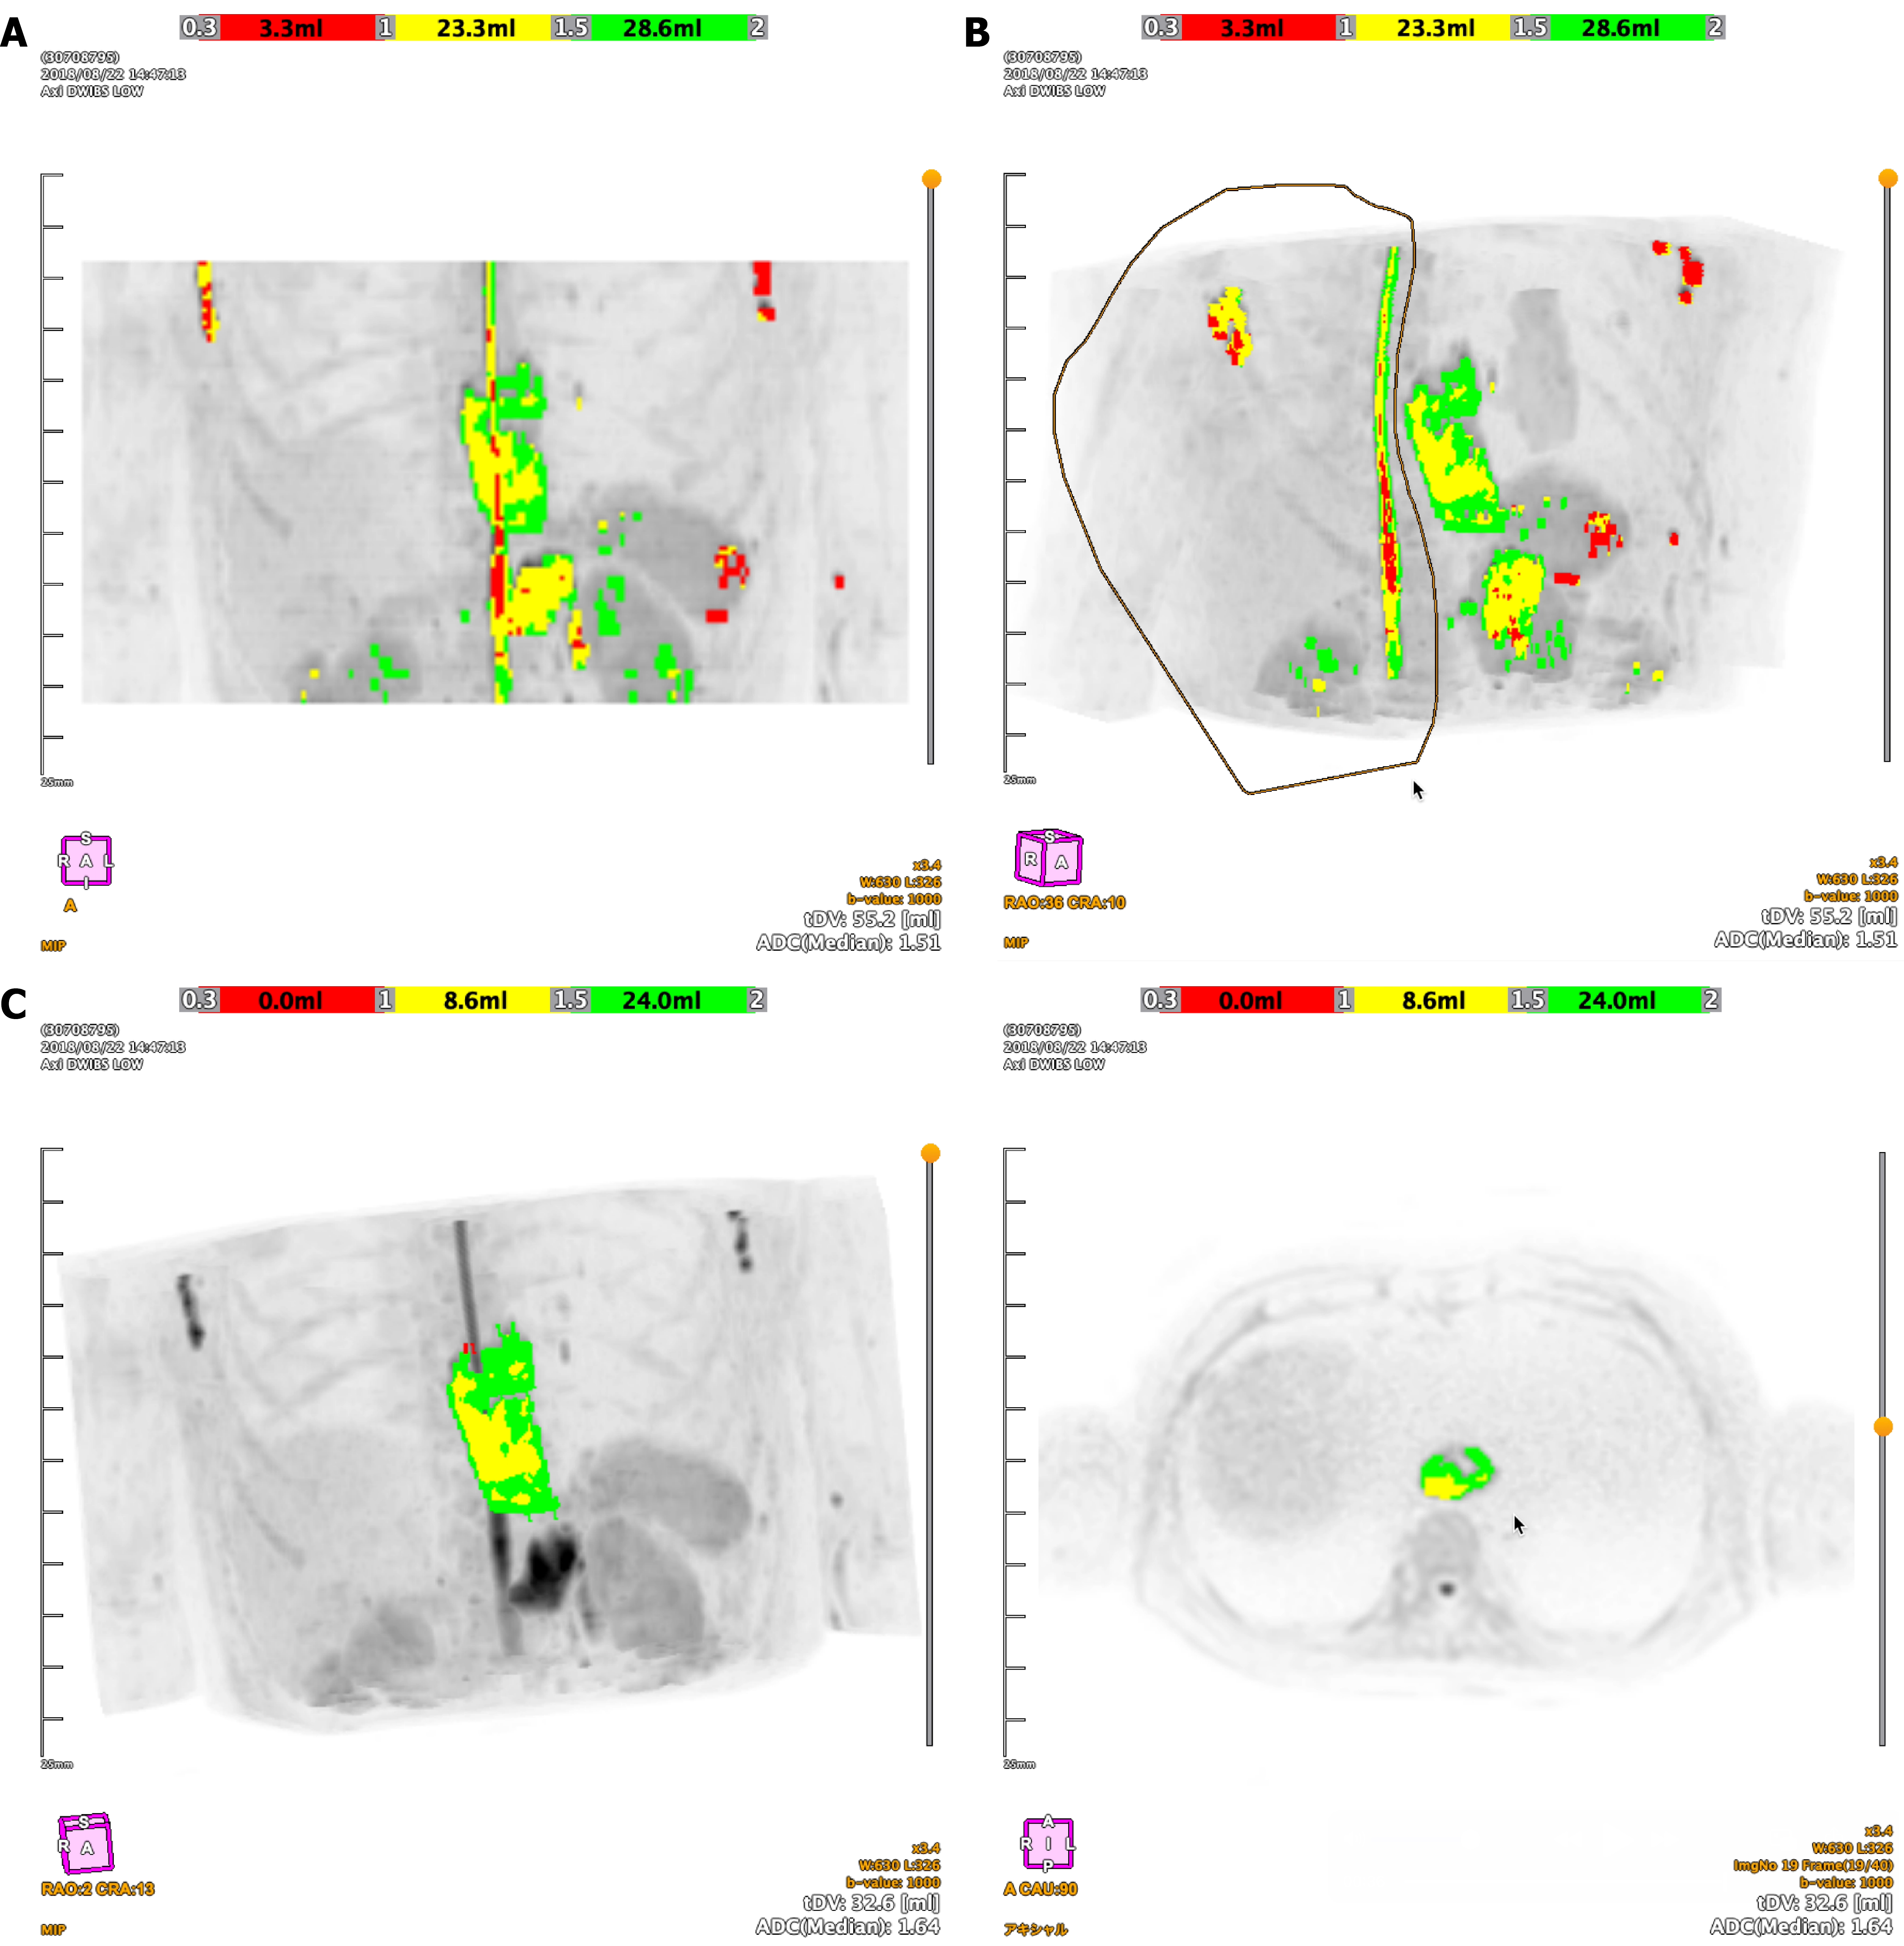
Figure 1 Workflow of semi-automated three dimensions tumor segmentation using BD score software.
A: A maximum intensity projection (MIP) image showing high-signal intensity areas automatically extracted from diffusion-weighted imaging; B: A MIP image demonstrating the manual editing process to exclude non-tumorous hyperintense structures from the initial automated segmentation; C: The final three dimensions tumor volume for radiomics analysis. The color overlay on the MIP (left) and axial (right) images corresponds to apparent diffusion coefficient values: Red (0.3-1.0 × 10⁻³ mm²/second), yellow (1.0-1.5 × 10⁻³ mm²/second), and green (1.5-2.0 × 10⁻³ mm²/second). ADC: Apparent diffusion coefficient; MIP: Maximum intensity projection.
- Citation: Hirata A, Hayano K, Tochigi T, Kurata Y, Shiraishi T, Sekino N, Nakano A, Matsumoto Y, Toyozumi T, Uesato M, Ohira G. Predicting pathological complete response to chemoradiotherapy using artificial intelligence-based magnetic resonance imaging radiomics in esophageal squamous cell carcinoma. World J Gastroenterol 2025; 31(36): 111293
- URL: https://www.wjgnet.com/1007-9327/full/v31/i36/111293.htm
- DOI: https://dx.doi.org/10.3748/wjg.v31.i36.111293