
















©The Author(s) 2025.
World J Gastroenterol. Sep 28, 2025; 31(36): 107703
Published online Sep 28, 2025. doi: 10.3748/wjg.v31.i36.107703
Published online Sep 28, 2025. doi: 10.3748/wjg.v31.i36.107703
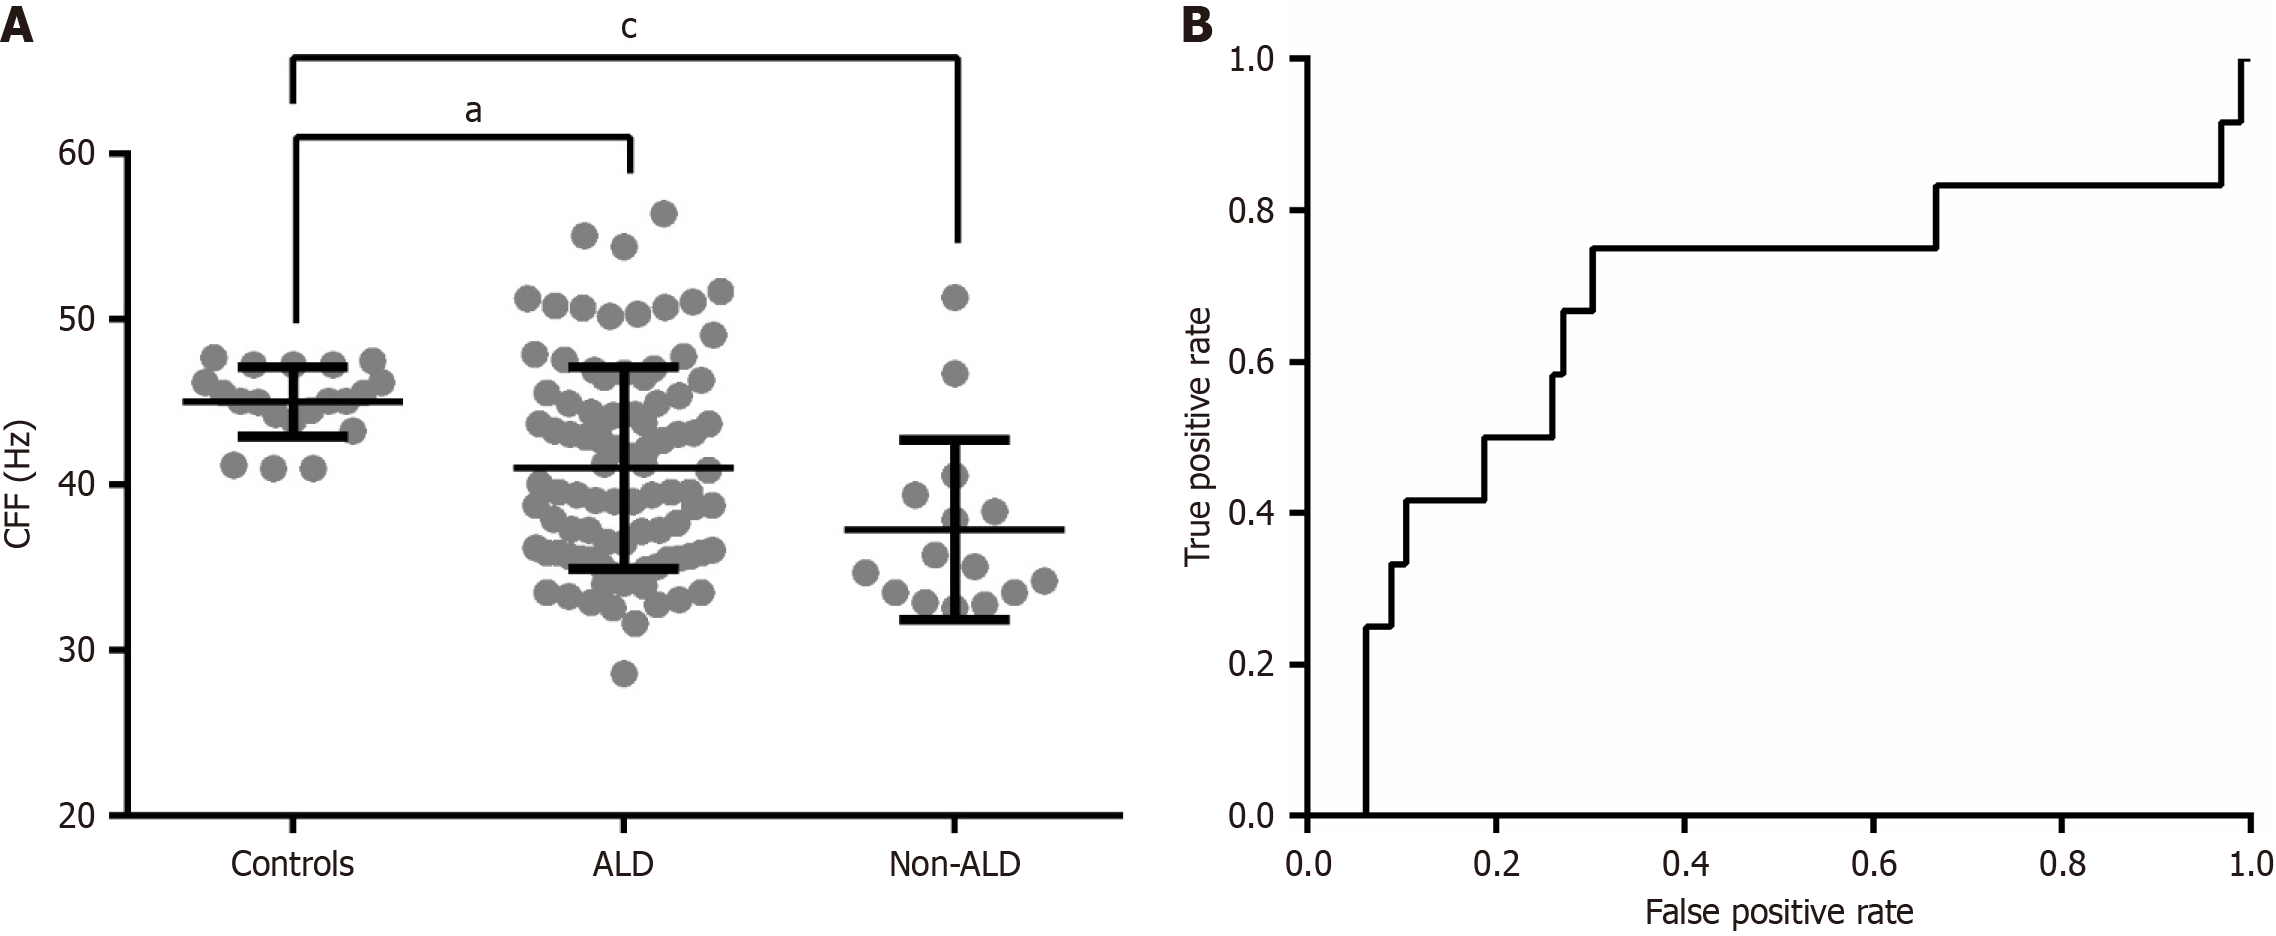
Figure 2 Critical flicker frequency in patients with and without alcohol-related liver disease and diagnostic accuracy to detect hepatic encephalopathy.
A: Critical flicker frequency (CFF) in patients with alcohol-related liver disease, non-alcohol-related liver disease etiologies, and healthy volunteers (controls). The mean CFF is significantly lower in disease groups compared to controls. However, a wider spread of CFF values is observed among patients, with some individuals showing higher CFF values than controls; B: Receiver operating characteristic curve for the detection of overt hepatic encephalopathy (n = 12). The area under the curve was 0.66 (95% confidence interval: 0.49-0.84, P = 0.0142), with an optimal cutoff for hepatic encephalopathy at 36.5 Hz. P values were determined using Tukey’s test. ALD: Alcohol-related liver disease; CFF: Critical flicker frequency. aP < 0.05, cP < 0.001.
- Citation: Elshaarawy O, Lan S, Mueller J, Mueller S. Critical flicker frequency improves after alcohol detoxification and is associated with liver stiffness. World J Gastroenterol 2025; 31(36): 107703
- URL: https://www.wjgnet.com/1007-9327/full/v31/i36/107703.htm
- DOI: https://dx.doi.org/10.3748/wjg.v31.i36.107703