
















©The Author(s) 2025.
World J Gastroenterol. Sep 21, 2025; 31(35): 109687
Published online Sep 21, 2025. doi: 10.3748/wjg.v31.i35.109687
Published online Sep 21, 2025. doi: 10.3748/wjg.v31.i35.109687
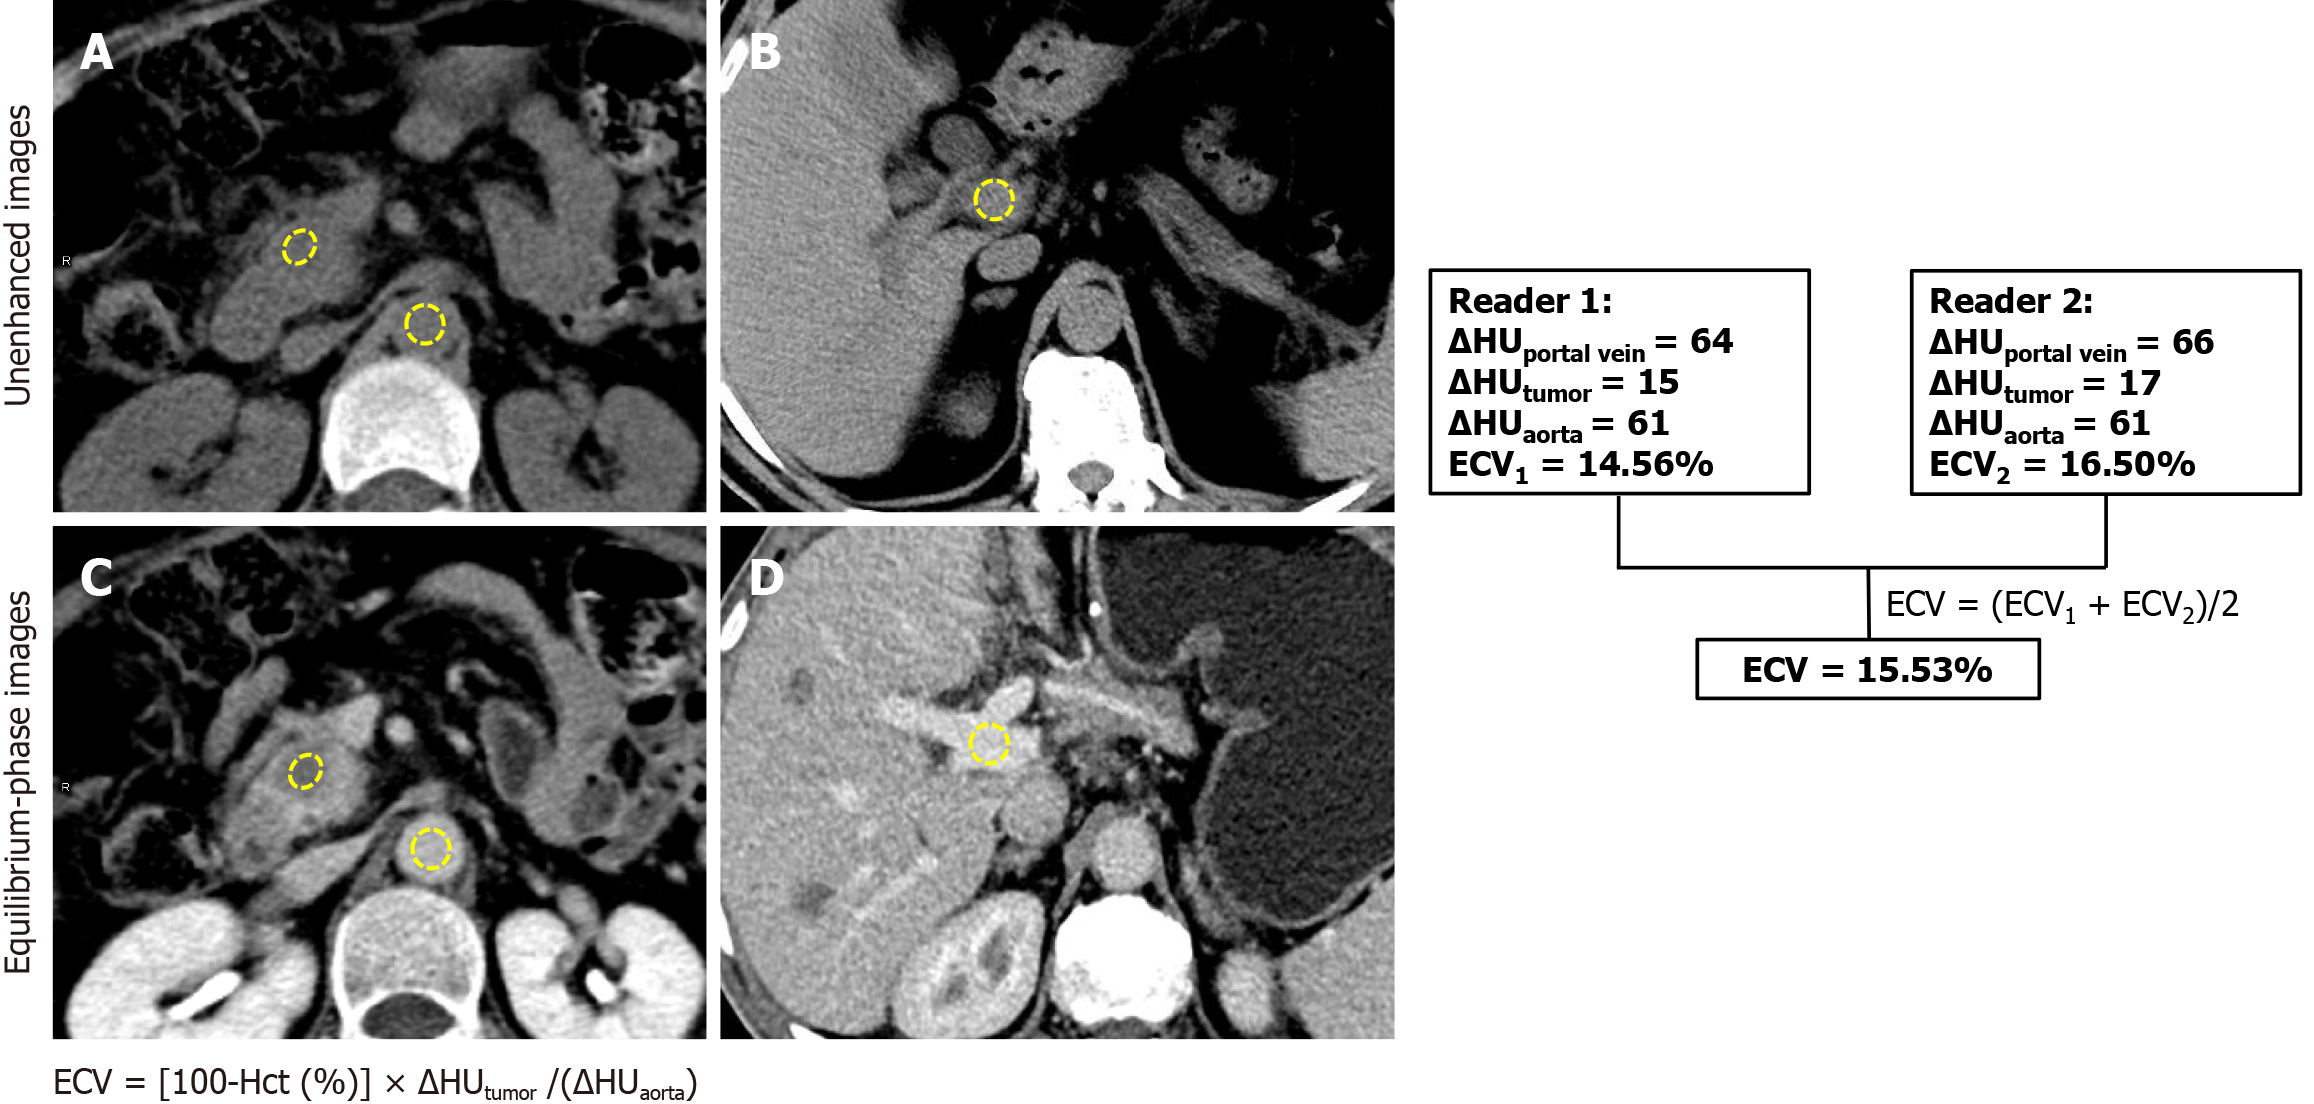
Figure 2 Computed tomography-derived extracellular volume calculation workflow.
The diagram illustrates the extracellular volume (ECV) calculation process in a 61-year-old male with pancreatic ductal adenocarcinoma who underwent radical (R0) resection, with a known hematocrit value of 40.8%. Region of interests were placed on the tumor, portal vein, and abdominal aorta. A and B: In preoperative baseline unenhanced; C and D: Equilibrium phase computed tomography (CT) images. The absolute difference between the ΔHounsfield unit (HU)aorta and ΔHUportal measured < 10 HU, confirming measurement validity. Two independent readers calculated CT-ECV values using the formula shown in the figure, with the final patient ECV (15.53%) derived as the mean of both measurements. ECV: Extracellular volume; Hct: Hematocrit; HU: Hounsfield unit.
- Citation: Zhang ZW, Liu HT, Zhou ZH, Liao HF, Zhang LL, Li YM, Liang HW. Preoperative risk stratification of early recurrence in resected pancreatic ductal adenocarcinoma: Novel equilibrium-phase-computed tomography biomarker of extracellular volume. World J Gastroenterol 2025; 31(35): 109687
- URL: https://www.wjgnet.com/1007-9327/full/v31/i35/109687.htm
- DOI: https://dx.doi.org/10.3748/wjg.v31.i35.109687