
















©The Author(s) 2025.
World J Gastroenterol. Sep 14, 2025; 31(34): 111541
Published online Sep 14, 2025. doi: 10.3748/wjg.v31.i34.111541
Published online Sep 14, 2025. doi: 10.3748/wjg.v31.i34.111541
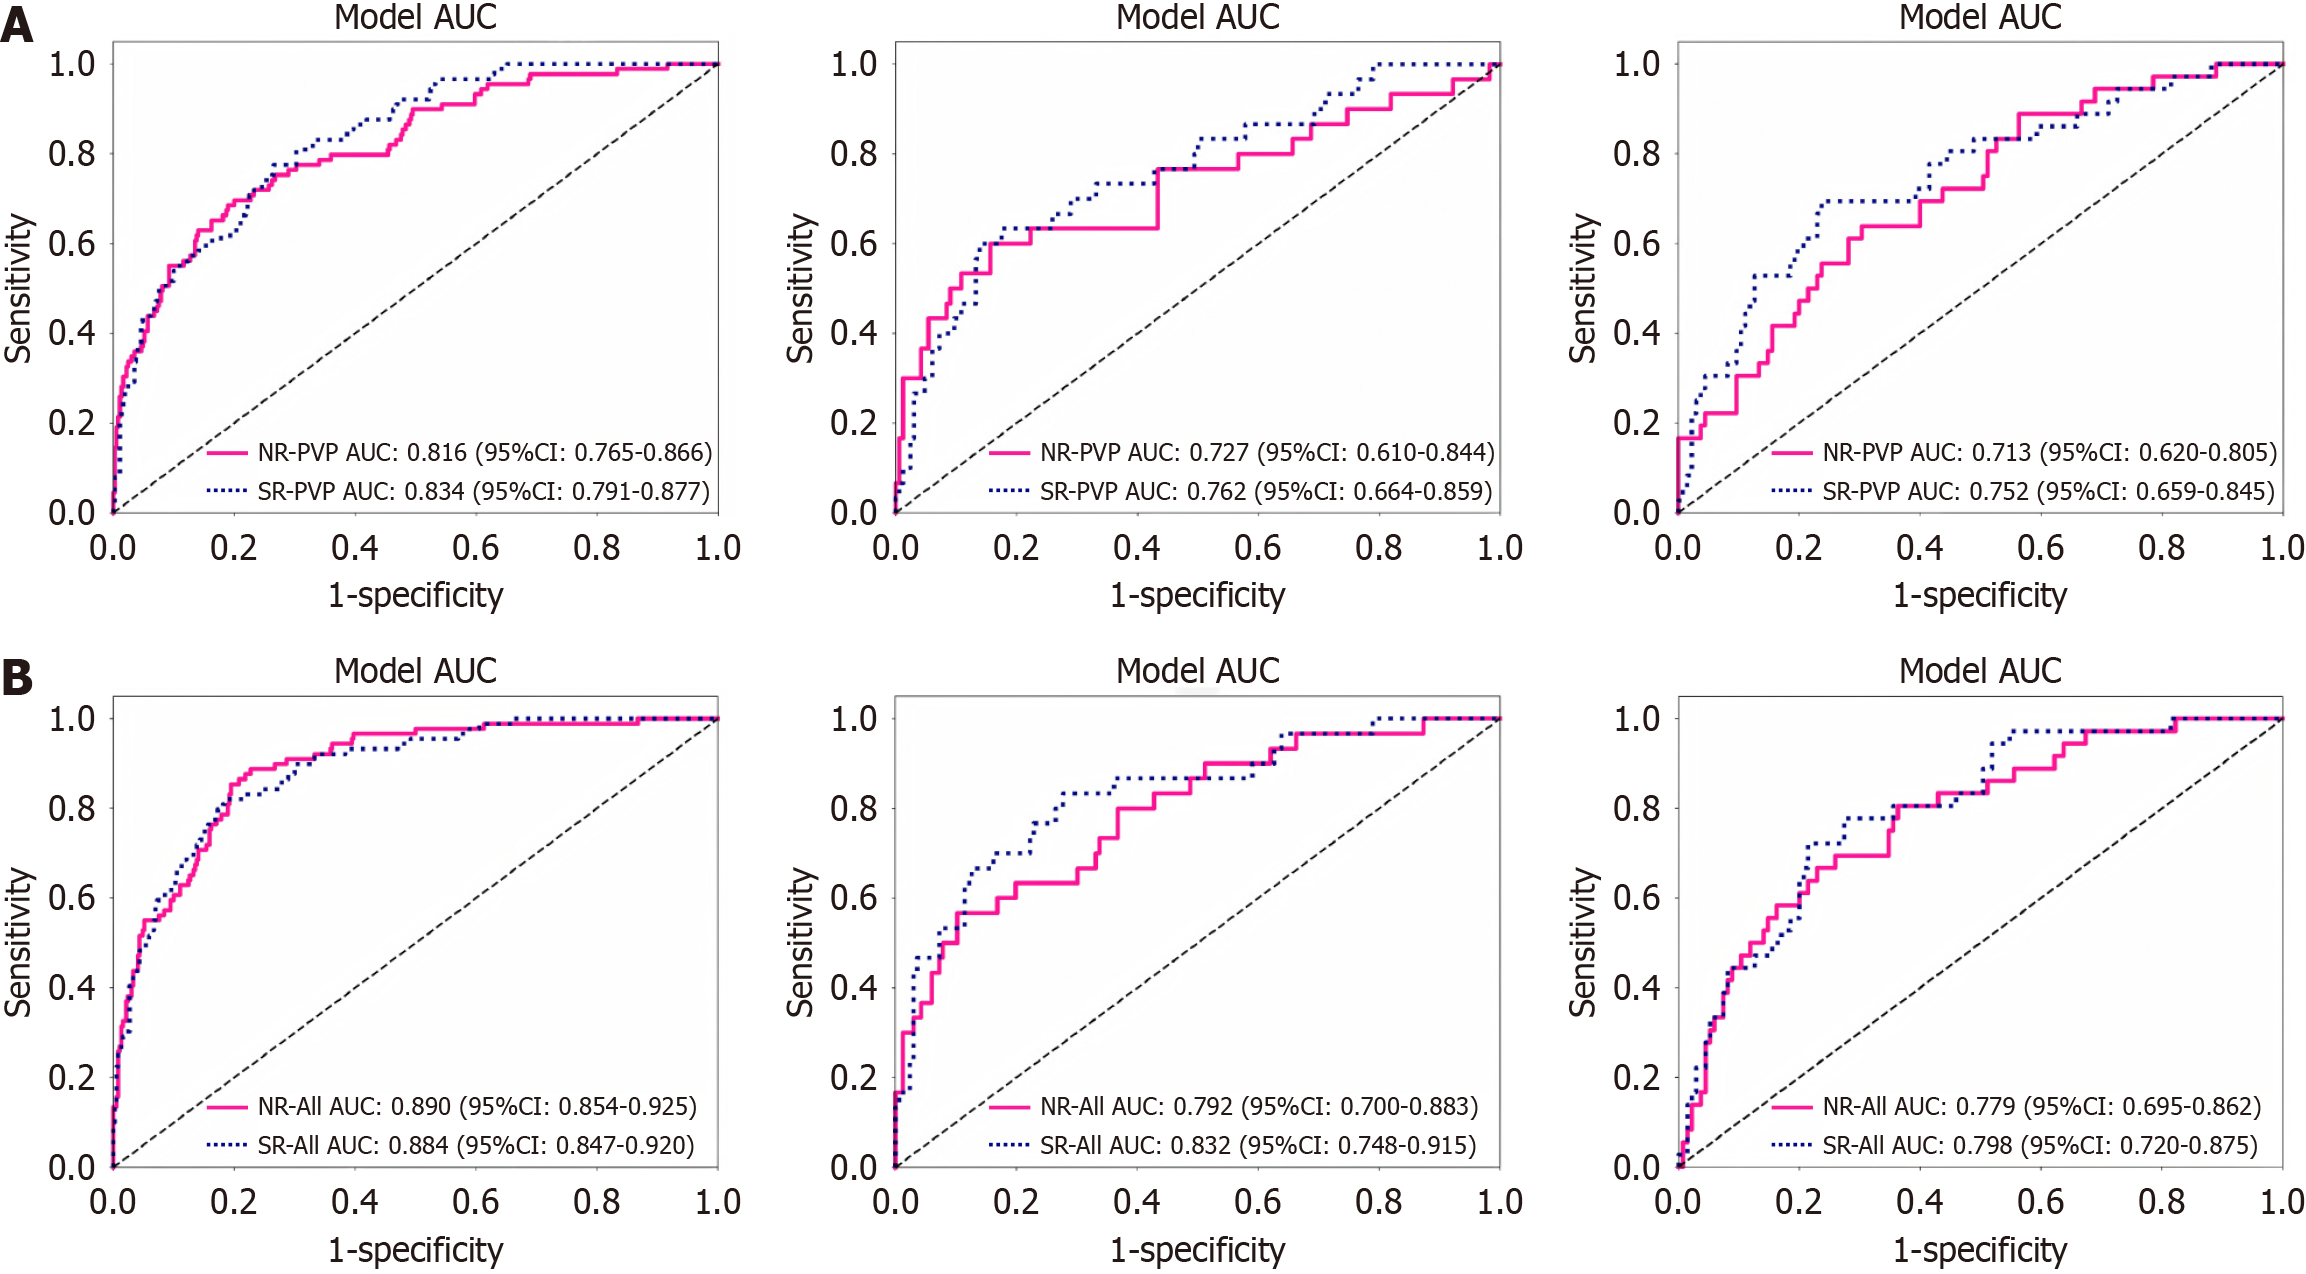
Figure 3 Comparison of receiver operating characteristic curves between normal-resolution and super-resolution magnetic resonance imaging in training, validation, and test cohorts, respectively.
A: Portal venous phase model; B: All-sequence model. “All” including three sequences (T2-weighted imaging, diffusion-weighted imaging, portal venous phase). AUC: Area under the curve; NR: Normal-resolution; SR: Super-resolution; PVP: Portal venous phase.
- Citation: Wang ZZ, Song SM, Zhang G, Chen RQ, Zhang ZC, Liu R. Multiparametric magnetic resonance imaging of deep learning-based super-resolution reconstruction for predicting histopathologic grade in hepatocellular carcinoma. World J Gastroenterol 2025; 31(34): 111541
- URL: https://www.wjgnet.com/1007-9327/full/v31/i34/111541.htm
- DOI: https://dx.doi.org/10.3748/wjg.v31.i34.111541