
















©The Author(s) 2025.
World J Gastroenterol. Sep 14, 2025; 31(34): 108617
Published online Sep 14, 2025. doi: 10.3748/wjg.v31.i34.108617
Published online Sep 14, 2025. doi: 10.3748/wjg.v31.i34.108617
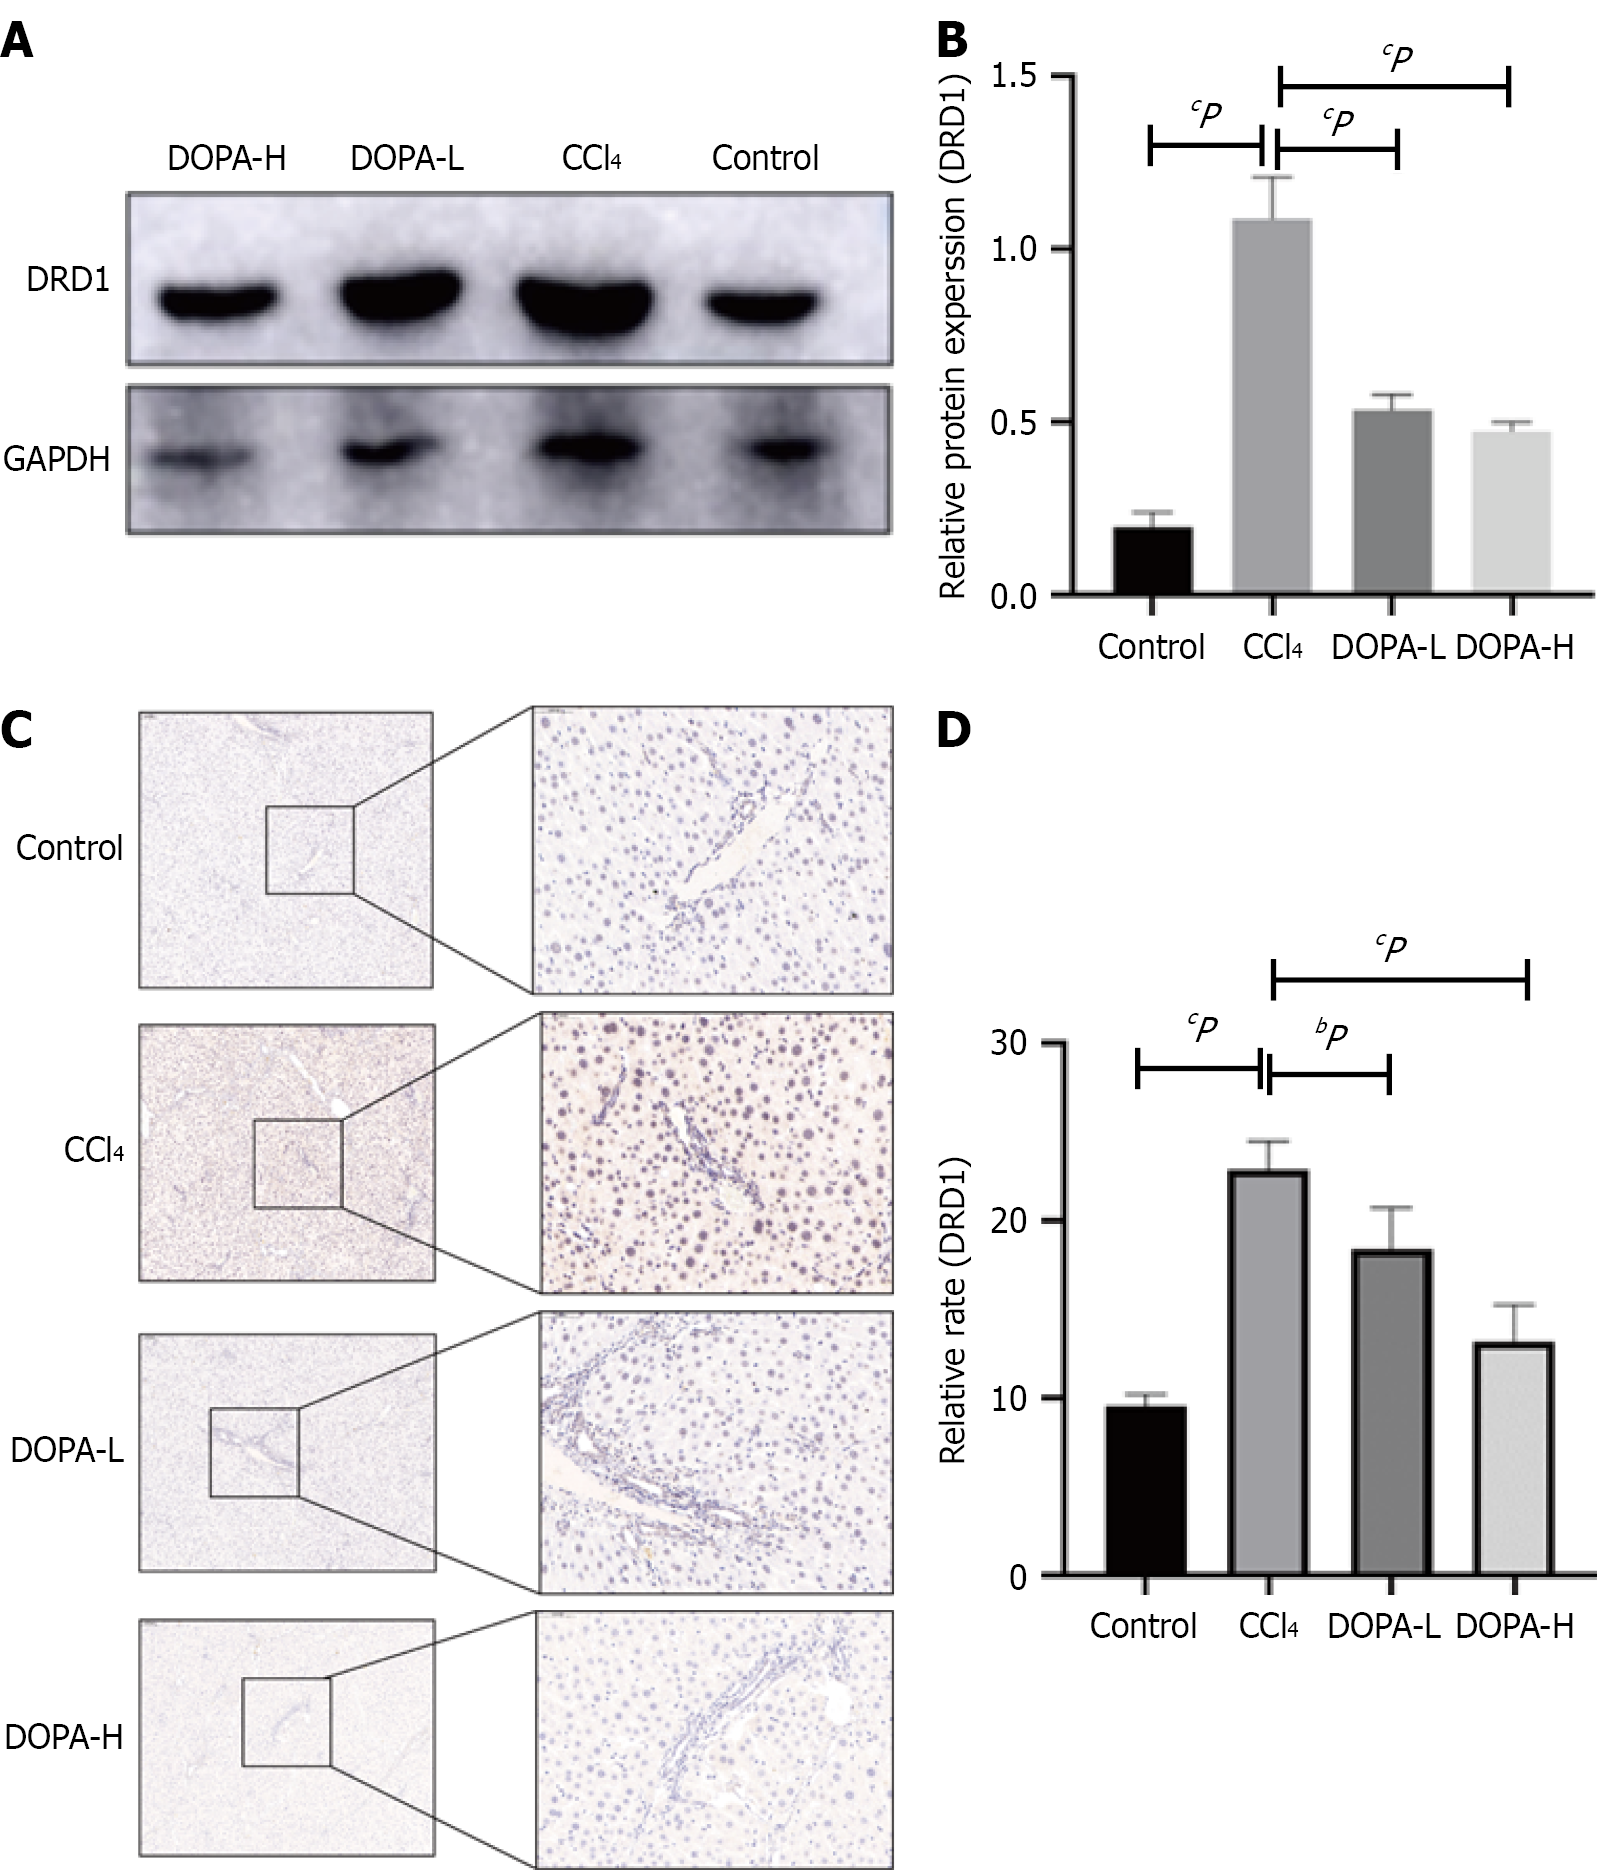
Figure 3 L-DOPA treatment of liver dopamine D1 pathway.
A and B: Western blotting analysis of dopamine D1 (DRD1) in lysed liver tissue, the results were standardized relative to GAPDH expression, and the representative protein bands (B) are displayed on the corresponding histogram; C: Representative fiber images of DRD1 immunohistochemistry in the liver (original magnification, × 100). Scale bar = 100 μm; D: ImageJ software (NIH) was used for quantitative analysis of DRD1 positive area, n = 8/group. bP < 0.01; cP < 0.001; NS: Not significant; CCl4: Carbon tetrachloride; DRD1: Dopamine D1.
- Citation: Wang HY, Qi MM, Zhang K, Zhu YZ, Zhang J. Dopamine receptor D1-mediated suppression of liver fibrosis via Hippo/Yes-associated protein 1 signaling in levodopa treatment. World J Gastroenterol 2025; 31(34): 108617
- URL: https://www.wjgnet.com/1007-9327/full/v31/i34/108617.htm
- DOI: https://dx.doi.org/10.3748/wjg.v31.i34.108617