
















©The Author(s) 2025.
World J Gastroenterol. Sep 7, 2025; 31(33): 107408
Published online Sep 7, 2025. doi: 10.3748/wjg.v31.i33.107408
Published online Sep 7, 2025. doi: 10.3748/wjg.v31.i33.107408
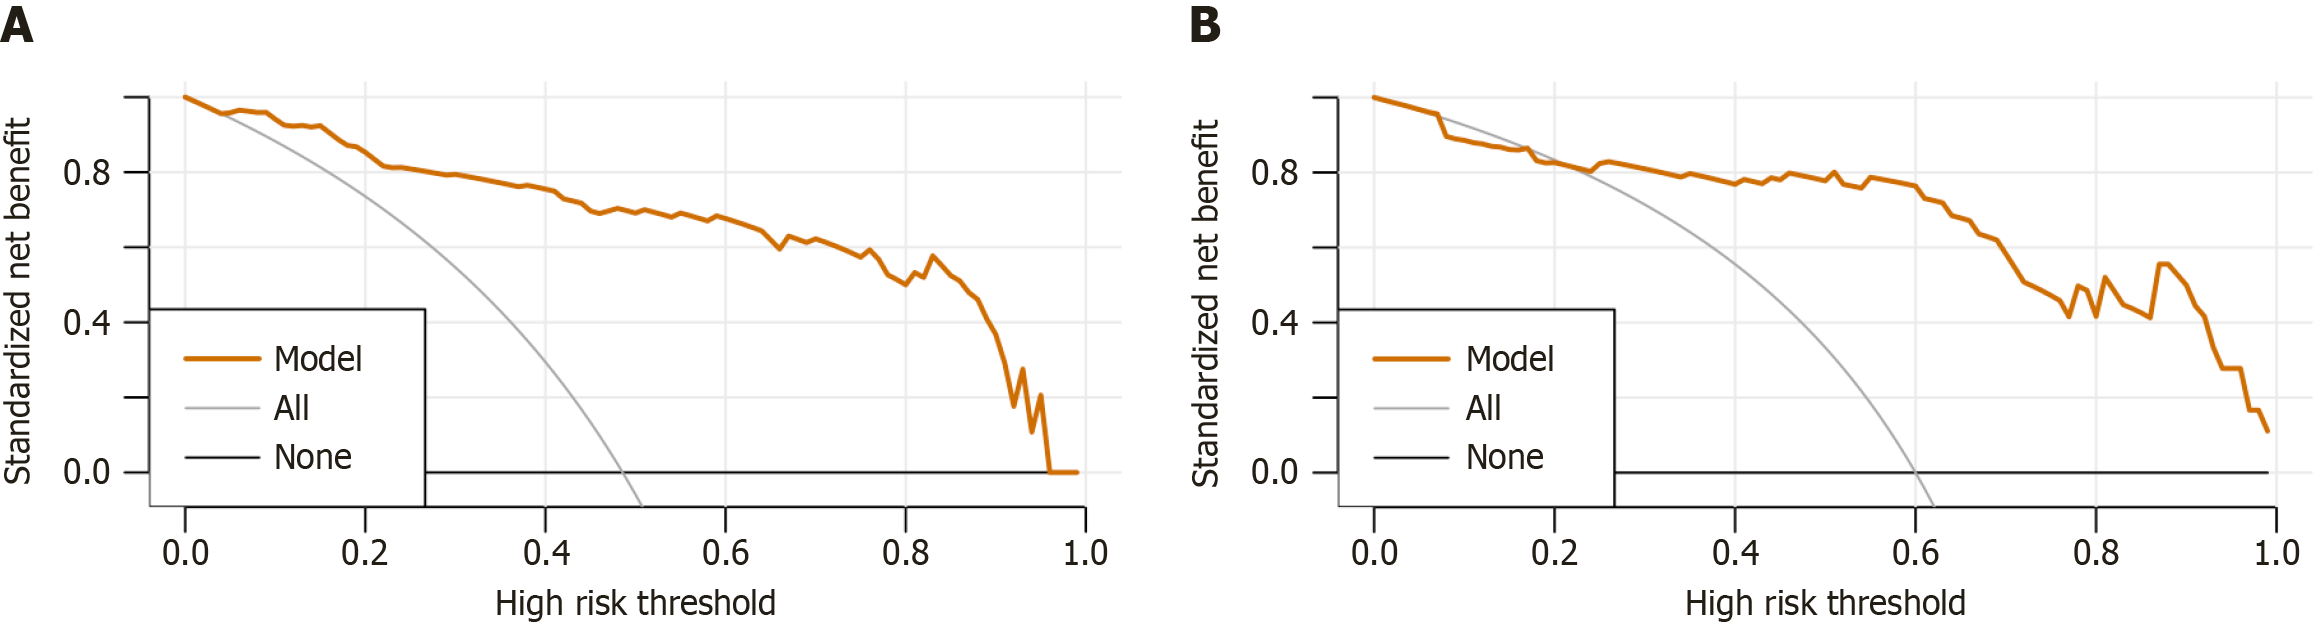
Figure 3 Adjusted decision curve analysis of patient data.
A: Modeling group; B: External validation group. The black line indicates that in extreme cases, the new model predicted that there was no clinical decompensation in patients with viral cirrhosis, and the clinical net benefit was 0. The gray curve indicates that in extreme cases, the new model predicts that there is clinical decompensation in all patients with viral cirrhosis, and the clinical net benefit is the negative slope. The red line indicates that the new model has a net clinical benefit. The red line is greater than the black and gray lines are, indicating that patients in the modeling group can benefit from the new model.
- Citation: Yang LB, Gao X, Xu M, Li Y, Dong L, Huang XD, She X, Zhang DY, Zhang QW, Liu CY, Fan ST, Wang Y. Noninvasive model based on liver and spleen stiffness for predicting clinical decompensation in patients with cirrhosis. World J Gastroenterol 2025; 31(33): 107408
- URL: https://www.wjgnet.com/1007-9327/full/v31/i33/107408.htm
- DOI: https://dx.doi.org/10.3748/wjg.v31.i33.107408