
















©The Author(s) 2025.
World J Gastroenterol. Aug 28, 2025; 31(32): 110333
Published online Aug 28, 2025. doi: 10.3748/wjg.v31.i32.110333
Published online Aug 28, 2025. doi: 10.3748/wjg.v31.i32.110333
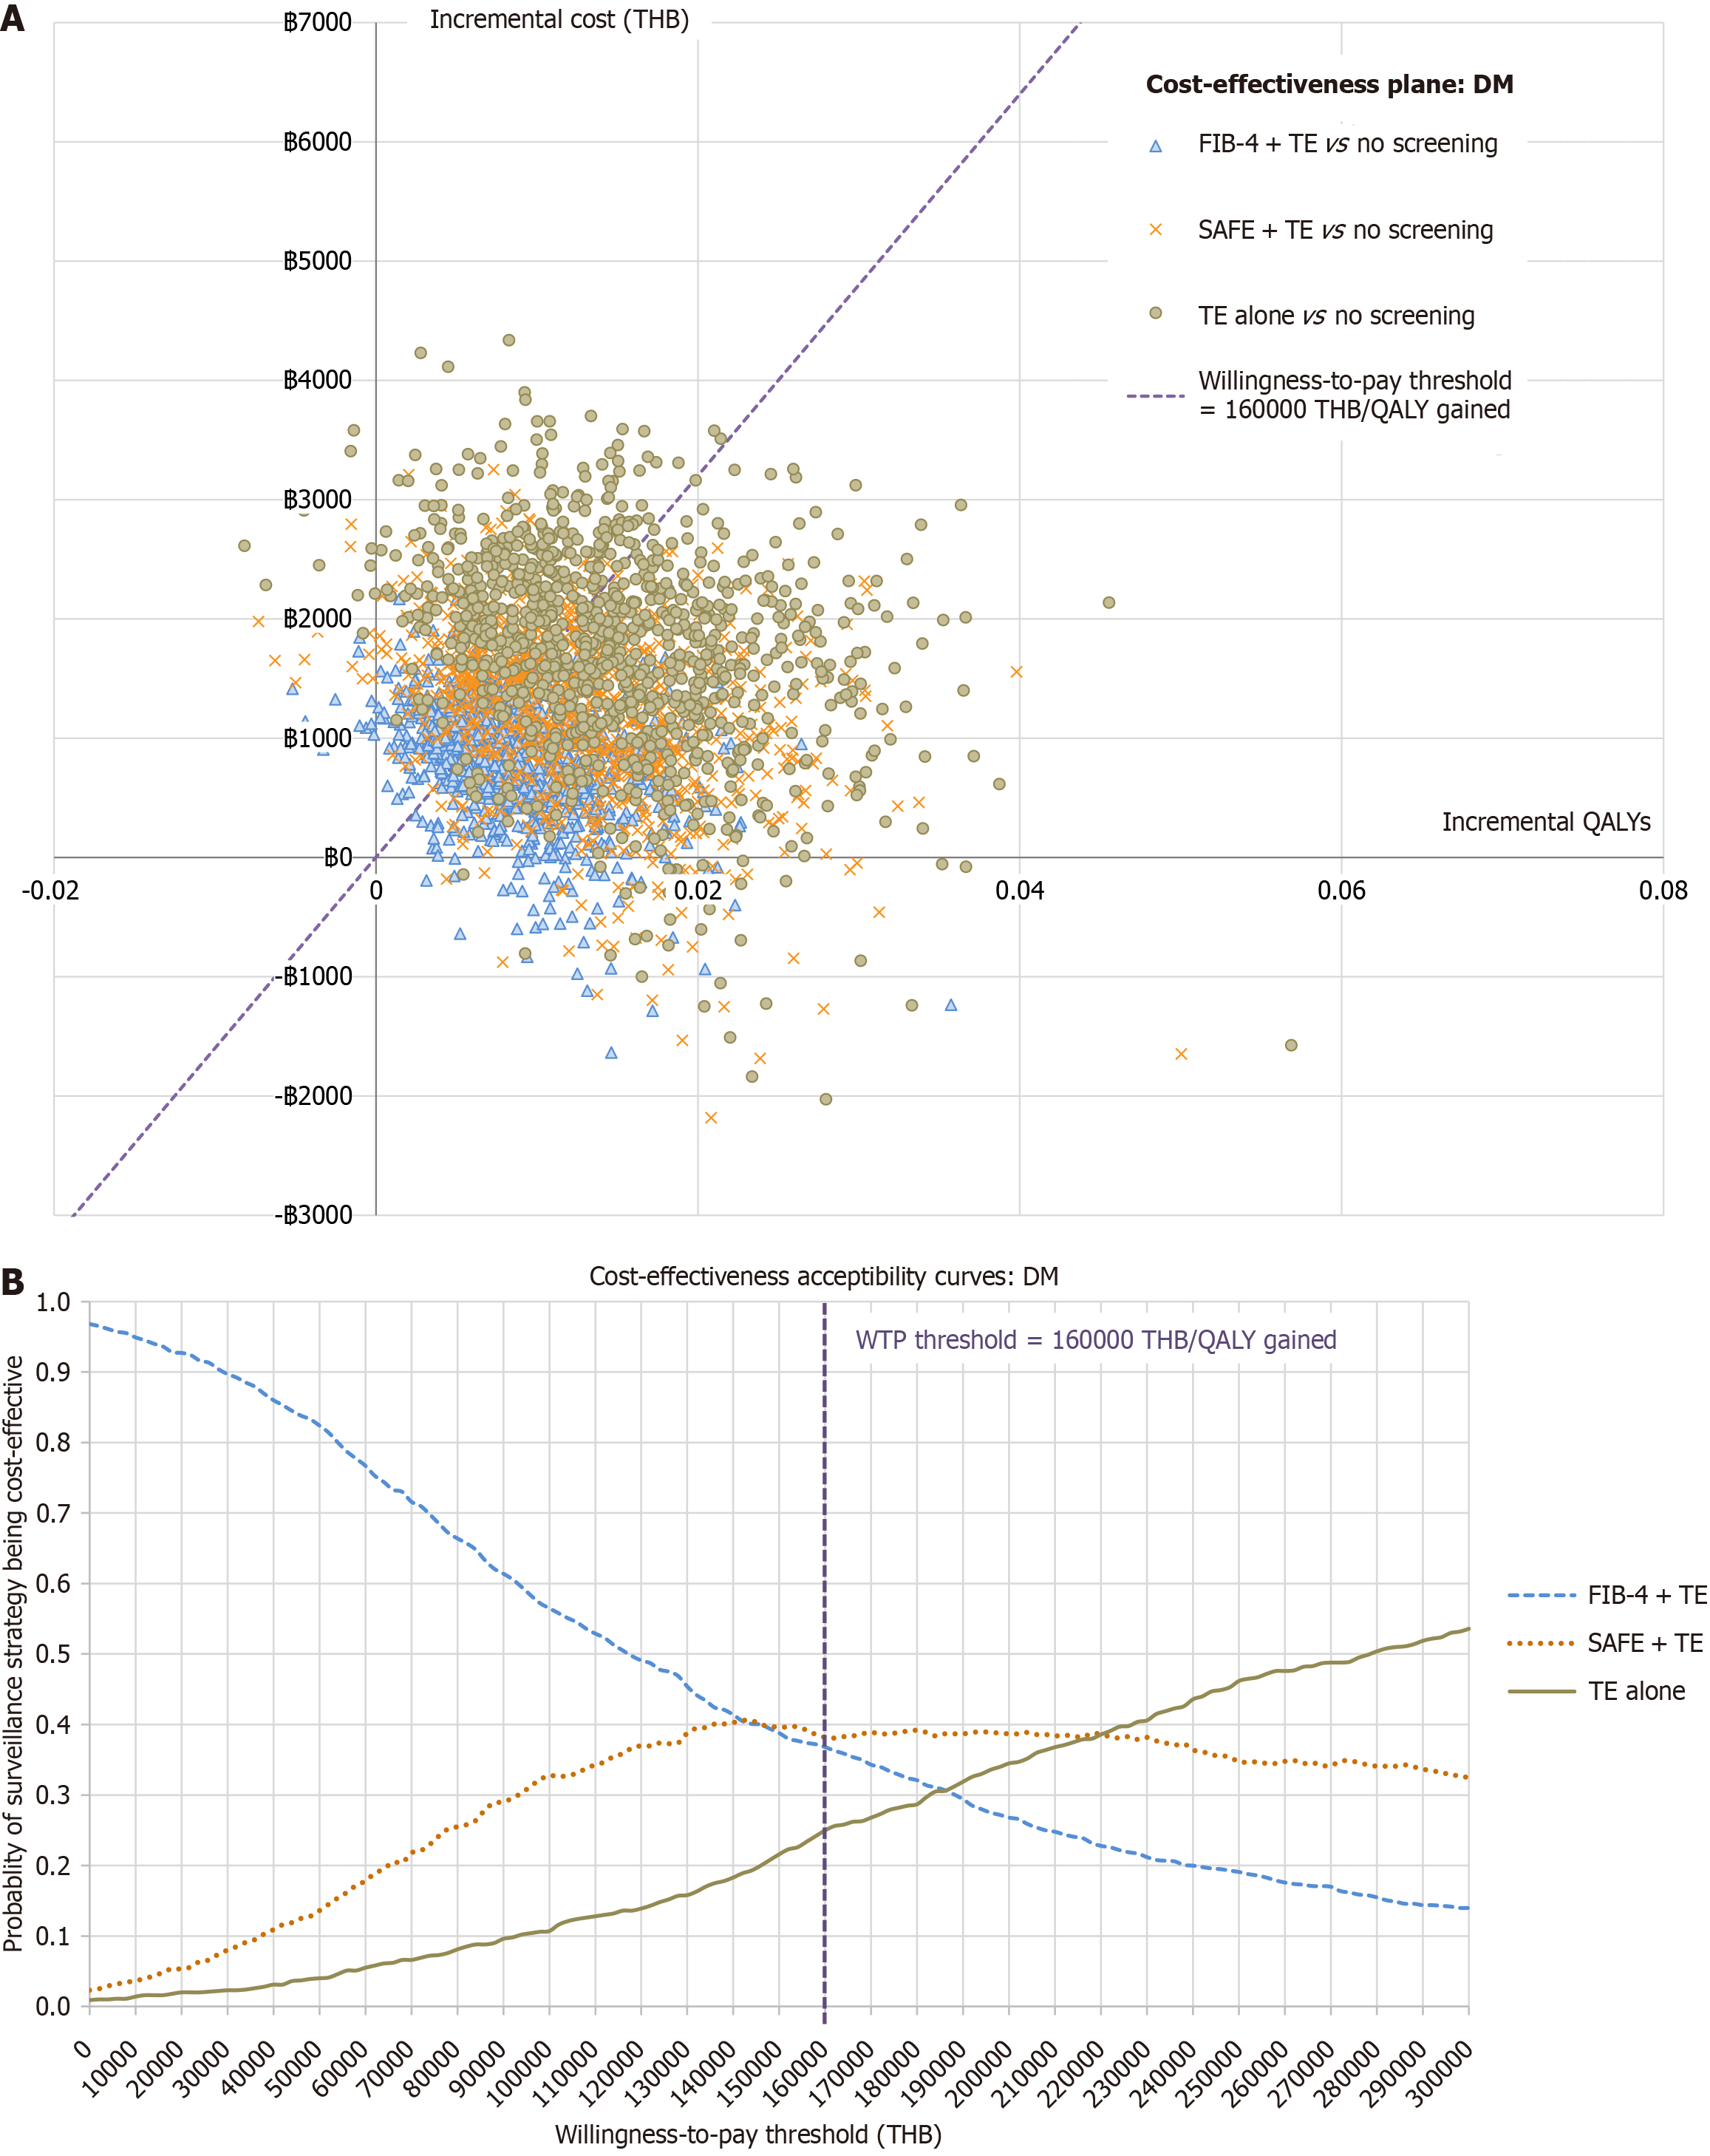
Figure 3 Probabilistic sensitivity analysis.
A: Cost-effectiveness plane plotting incremental costs (vertical axis) against incremental quality-adjusted life-years (QALYs) (horizontal axis) for each strategy vs no screening. Points below the dashed purple line (Thai willingness-to-pay threshold) are deemed cost-effective; B: Cost-effectiveness acceptability curves illustrating, across a continuum of willingness-to-pay thresholds, the probability that each strategy is cost-effective; the current Thai threshold is marked by the dashed purple line. DM: Diabetes mellitus; FIB-4: Fibrosis-4 index; SAFE: Steatosis-associated fibrosis estimator score; TE: Transient elastography; THB: Thai baht.
- Citation: Kositamongkol C, Tantiyavarong P, Ratanatawan A, Sripongpun P, Mahawithitwong P, Kositamongkol P, Saokaew S, Phisalprapa P. Cost-effectiveness of transient elastography for liver fibrosis screening in Thai patients with diabetes mellitus. World J Gastroenterol 2025; 31(32): 110333
- URL: https://www.wjgnet.com/1007-9327/full/v31/i32/110333.htm
- DOI: https://dx.doi.org/10.3748/wjg.v31.i32.110333