
















©The Author(s) 2025.
World J Gastroenterol. Aug 28, 2025; 31(32): 110333
Published online Aug 28, 2025. doi: 10.3748/wjg.v31.i32.110333
Published online Aug 28, 2025. doi: 10.3748/wjg.v31.i32.110333
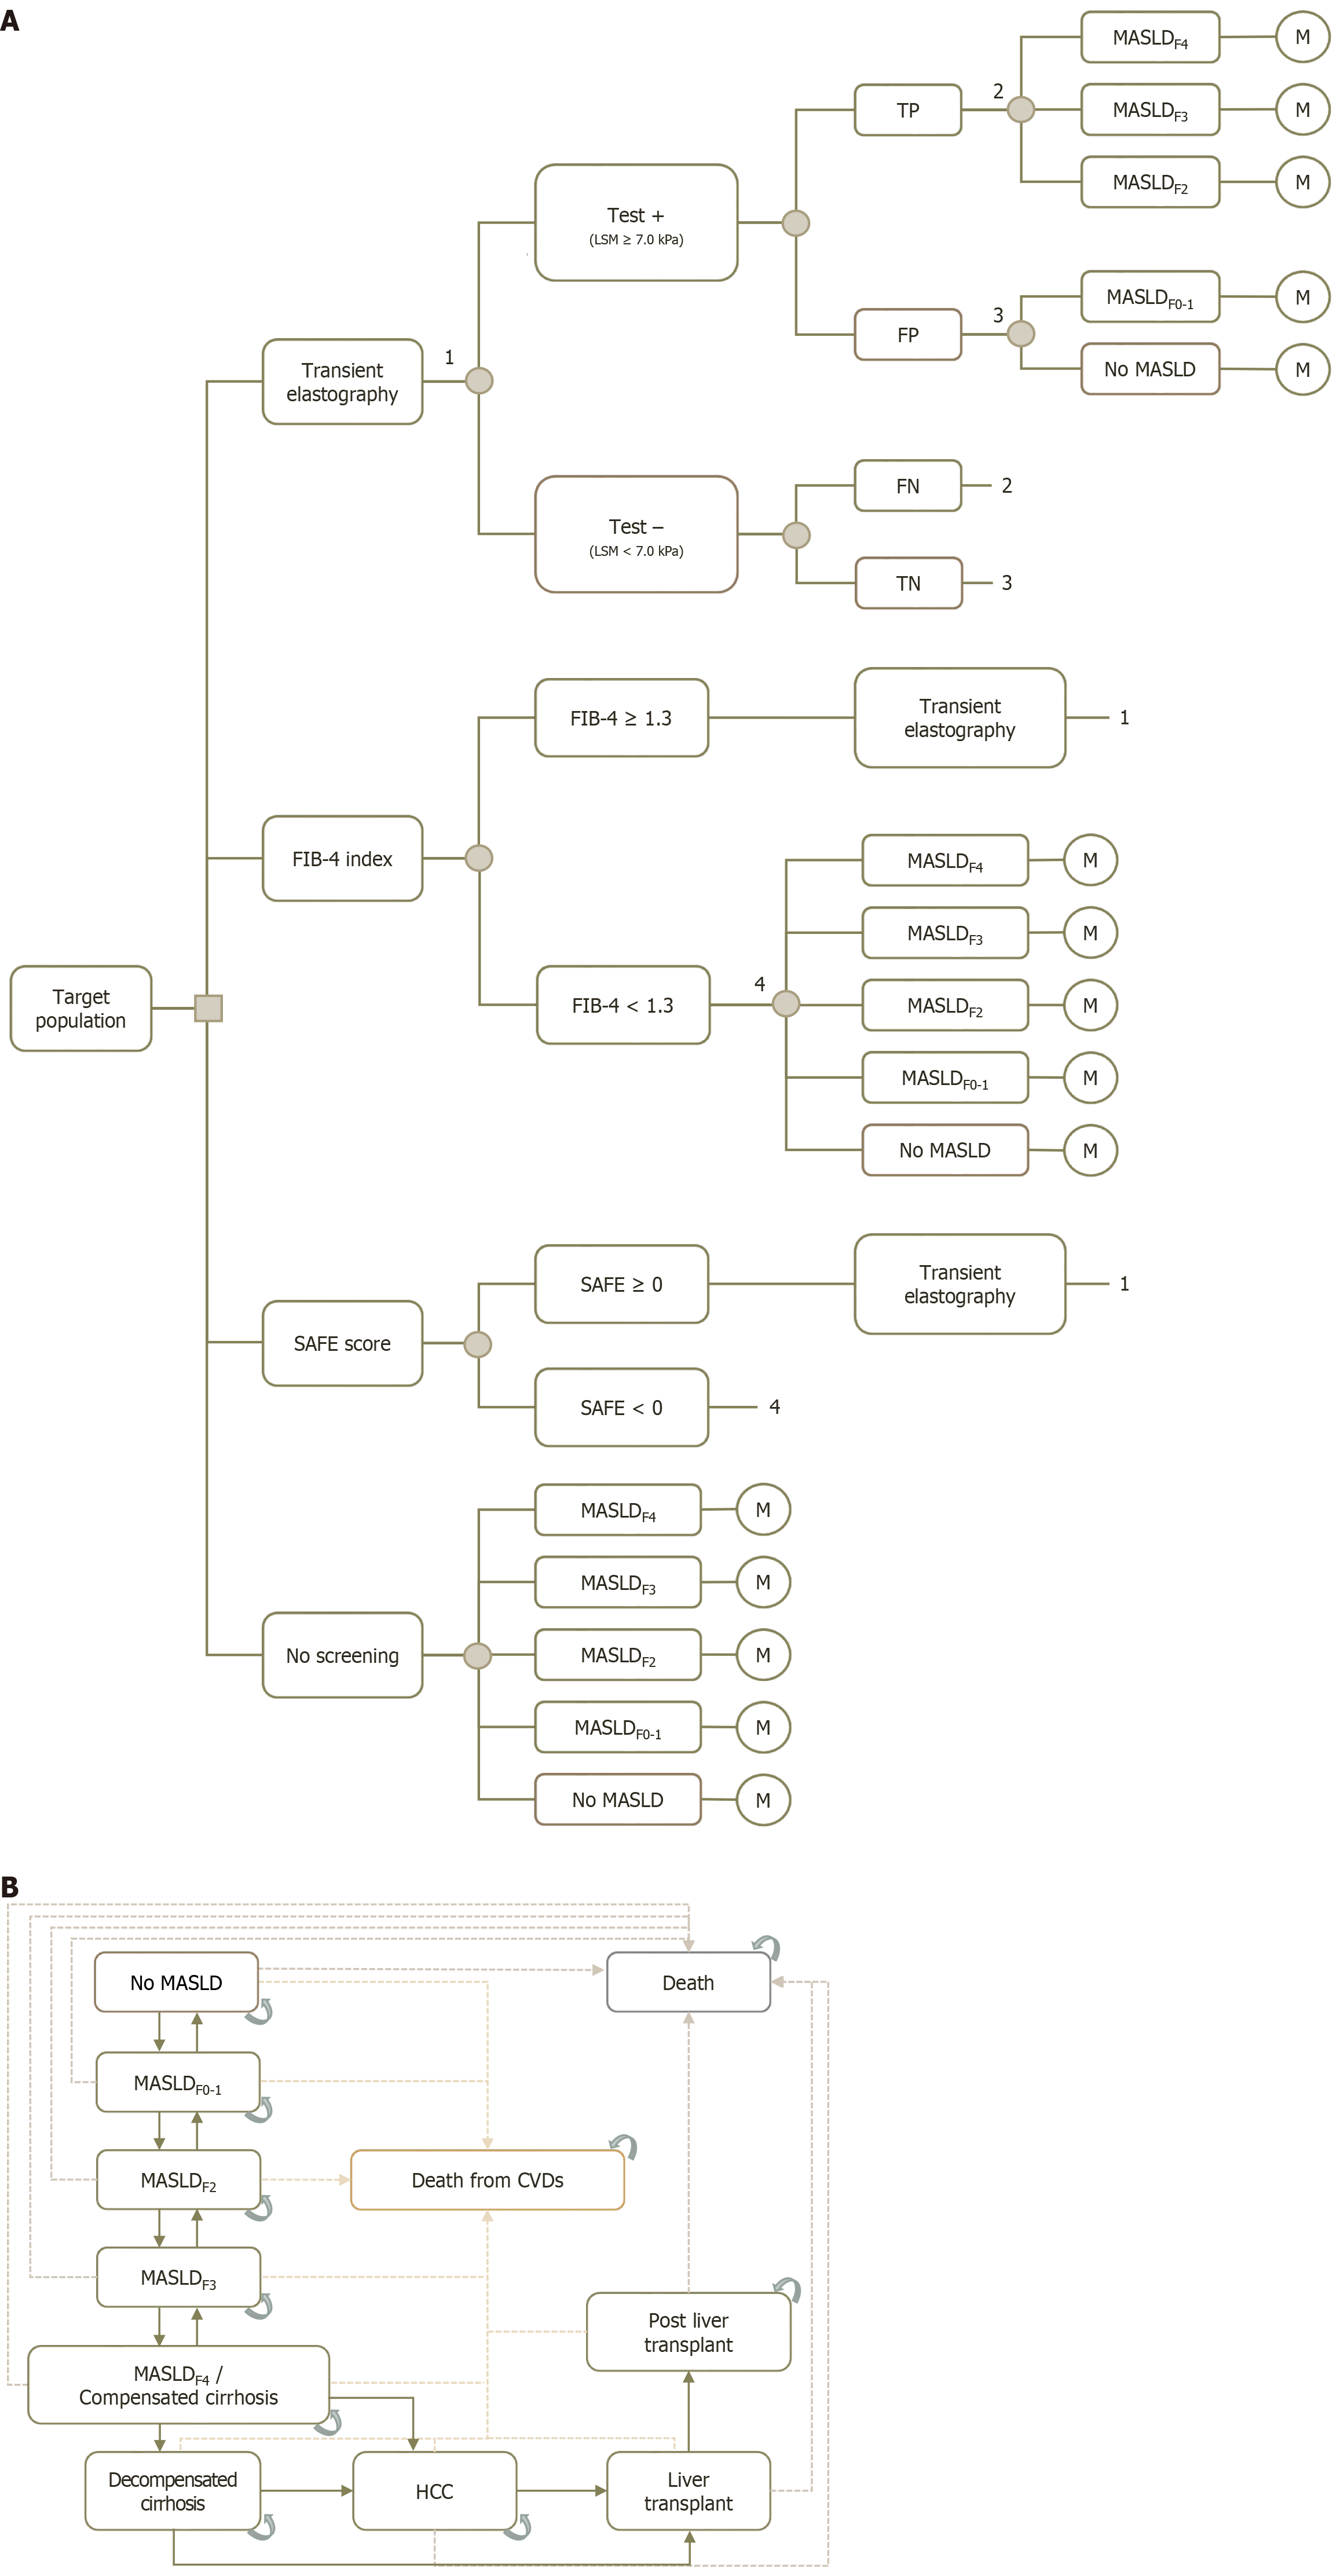
Figure 1 Models.
A: Decision tree; B: Markov model. In the decision tree, the decision node is represented by a square symbol, while chance nodes are depicted using circle symbols. In the Markov model, rounded rectangles represent possible metabolic dysfunction-associated steatotic liver disease-related health states of the patients. The "death" health states encompass mortality from all causes. Arrows indicate the possible pathways that patients may transition through within the model. Solid line arrows represent transitional probabilities, dashed arrows represent those transit to the death states. 1Test results from transient elastography. 2Outcomes following true positive (TP) and false negative (FN) results from transient elastography. 3Outcomes following false positive (FP) and true negative (TN) results from transient elastography. 4Outcomes of patients with scores below the cutoff values of the scoring systems. CVD: Cardiovascular disease; F: Fibrosis stage; HCC: Hepatocellular carcinoma; M: Markov; MASLD: Metabolic dysfunction-associated steatotic liver disease.
- Citation: Kositamongkol C, Tantiyavarong P, Ratanatawan A, Sripongpun P, Mahawithitwong P, Kositamongkol P, Saokaew S, Phisalprapa P. Cost-effectiveness of transient elastography for liver fibrosis screening in Thai patients with diabetes mellitus. World J Gastroenterol 2025; 31(32): 110333
- URL: https://www.wjgnet.com/1007-9327/full/v31/i32/110333.htm
- DOI: https://dx.doi.org/10.3748/wjg.v31.i32.110333