















©The Author(s) 2025.
World J Gastroenterol. Jan 21, 2025; 31(3): 95207
Published online Jan 21, 2025. doi: 10.3748/wjg.v31.i3.95207
Published online Jan 21, 2025. doi: 10.3748/wjg.v31.i3.95207
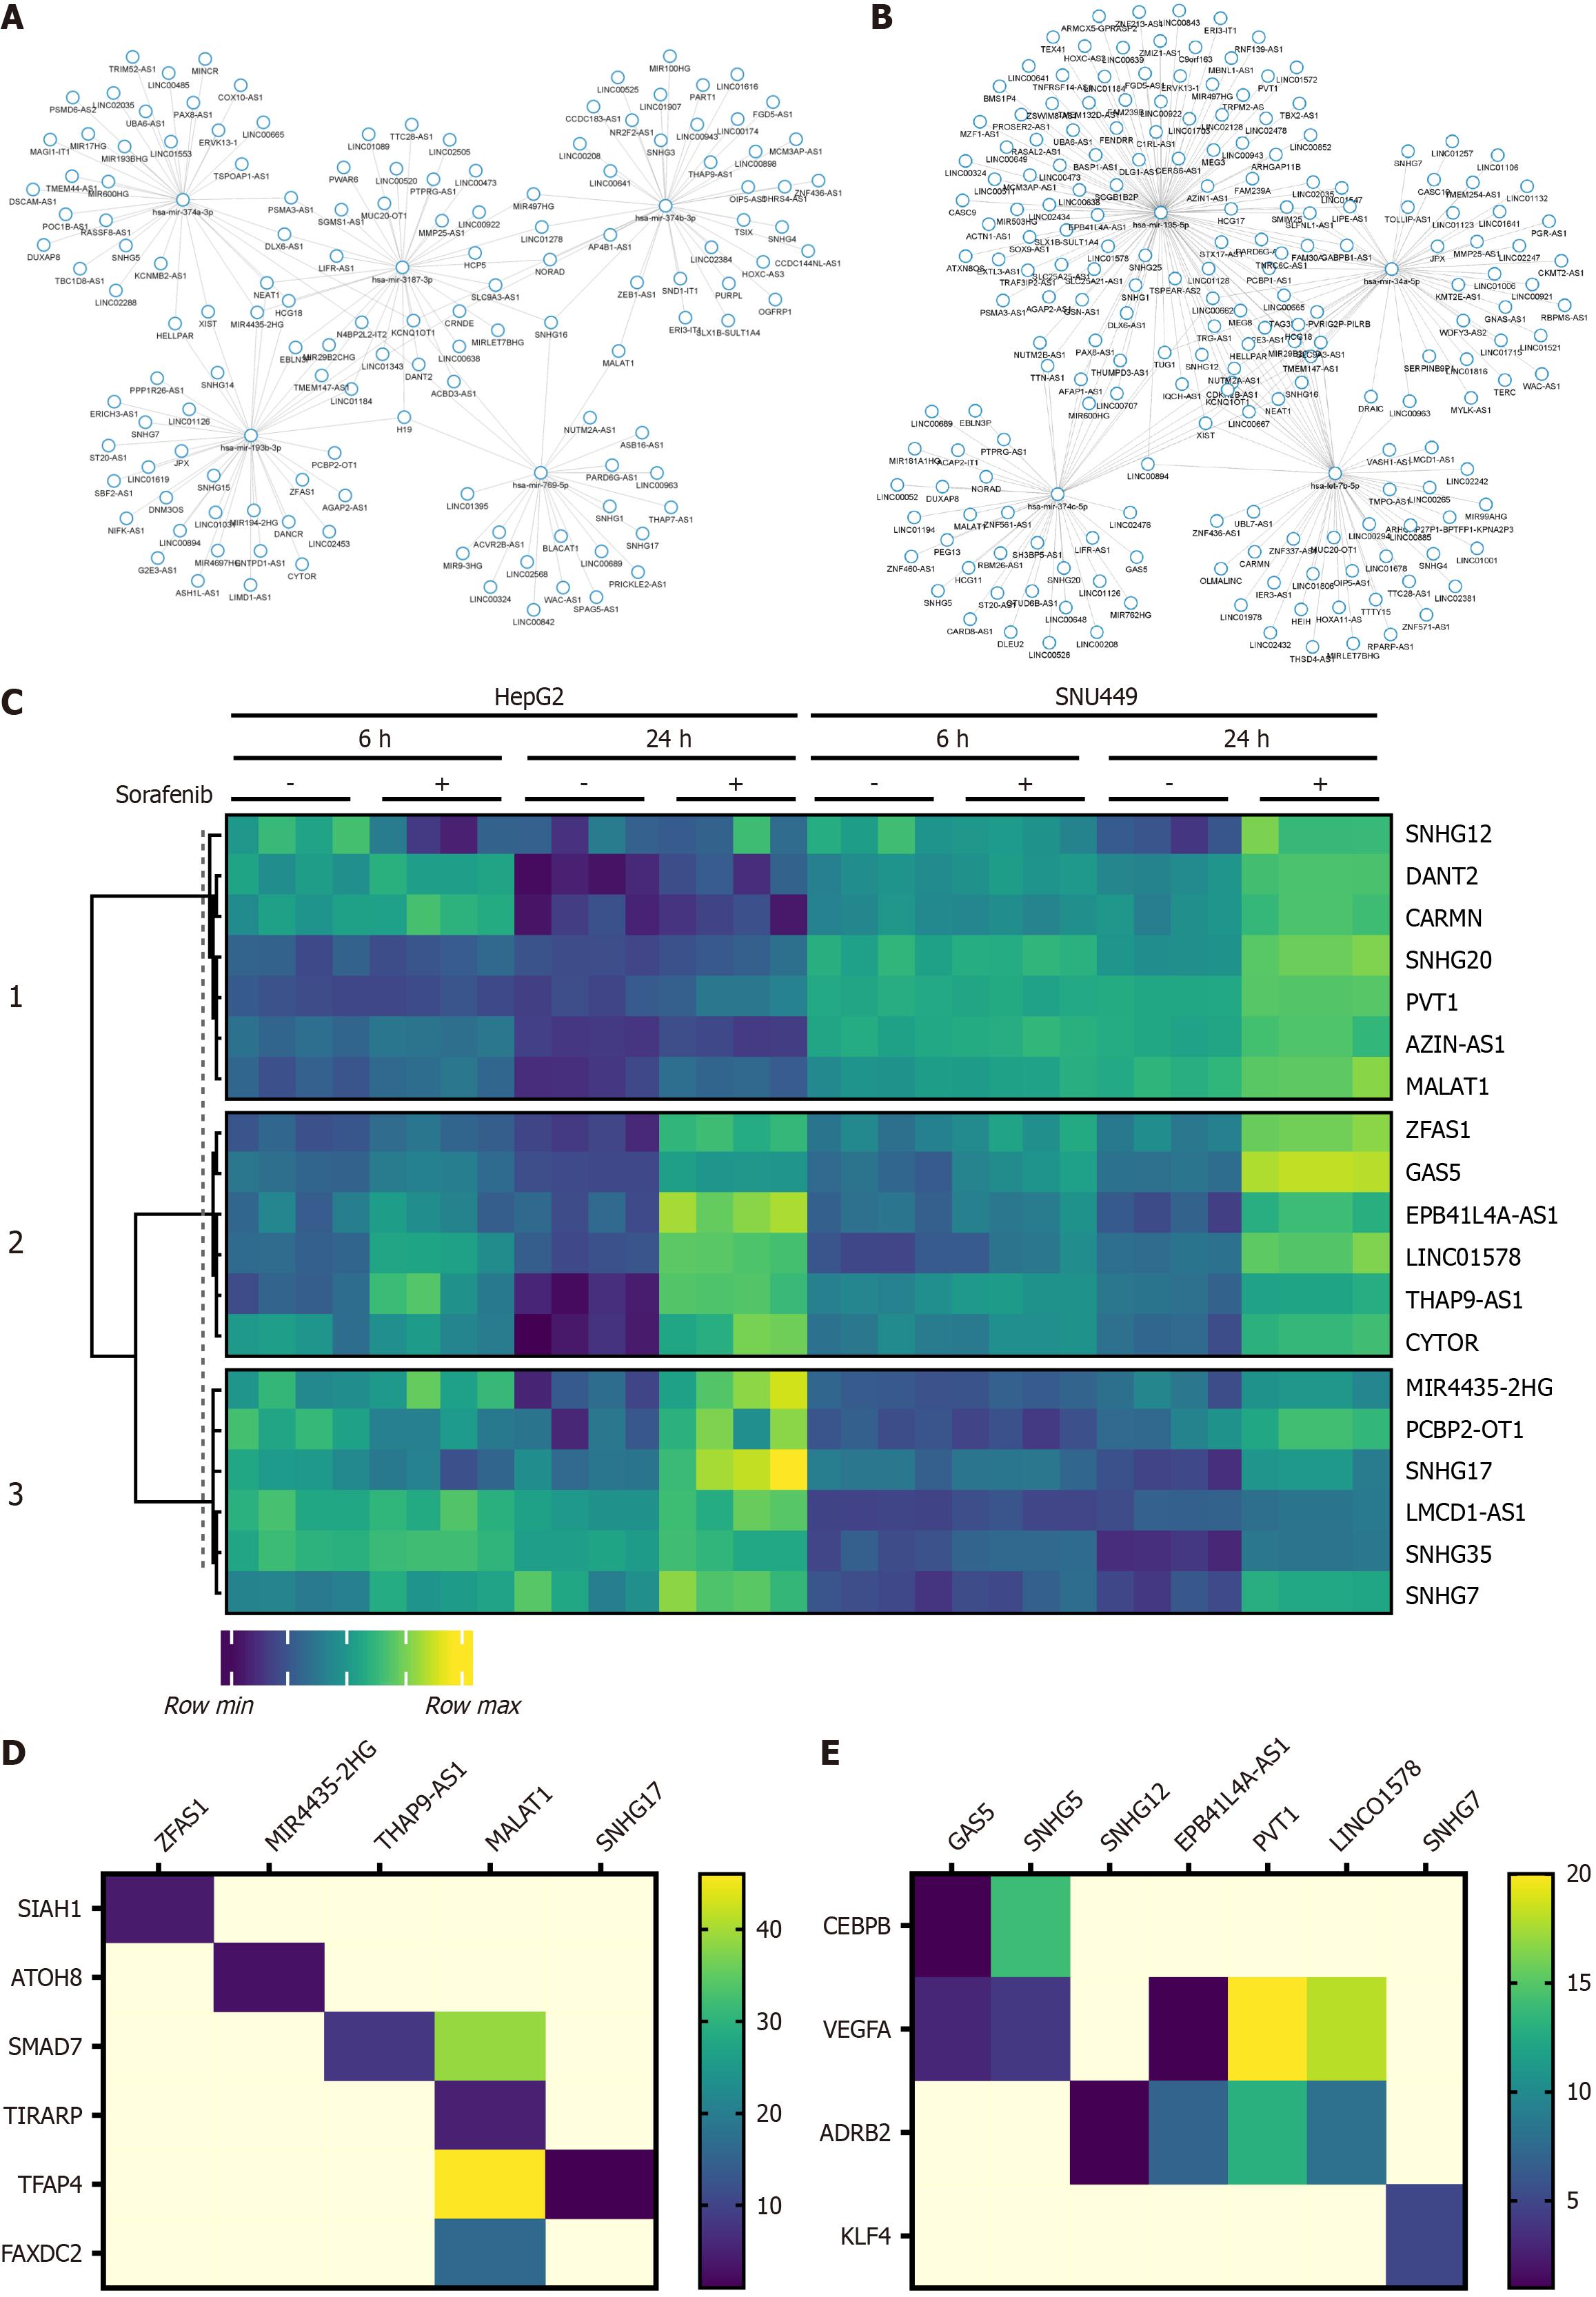
Figure 5 Identification of lncRNA candidates.
A and B: Gene regulatory networks showing miRNA-lncRNA interaction predictions in HepG2 and SNU449 cells treated with Sorafenib for 24 hours; C: Heatmap of selected lncRNAs in HepG2 and SNU449 cells for lncRNA-mRNA interactions; D and E: Heatmaps representing the number of interactions between lncRNA and mRNA targets of their corresponding miRNA interactions in HepG2 and SNU449 cells treated with Sorafenib (24 hours).
- Citation: de la Cruz-Ojeda P, Parras-Martínez E, Rey-Pérez R, Muntané J. In silico analysis of lncRNA-miRNA-mRNA signatures related to Sorafenib effectiveness in liver cancer cells. World J Gastroenterol 2025; 31(3): 95207
- URL: https://www.wjgnet.com/1007-9327/full/v31/i3/95207.htm
- DOI: https://dx.doi.org/10.3748/wjg.v31.i3.95207