Copyright
©The Author(s) 2025.
World J Gastroenterol. Jun 14, 2025; 31(22): 105201
Published online Jun 14, 2025. doi: 10.3748/wjg.v31.i22.105201
Published online Jun 14, 2025. doi: 10.3748/wjg.v31.i22.105201
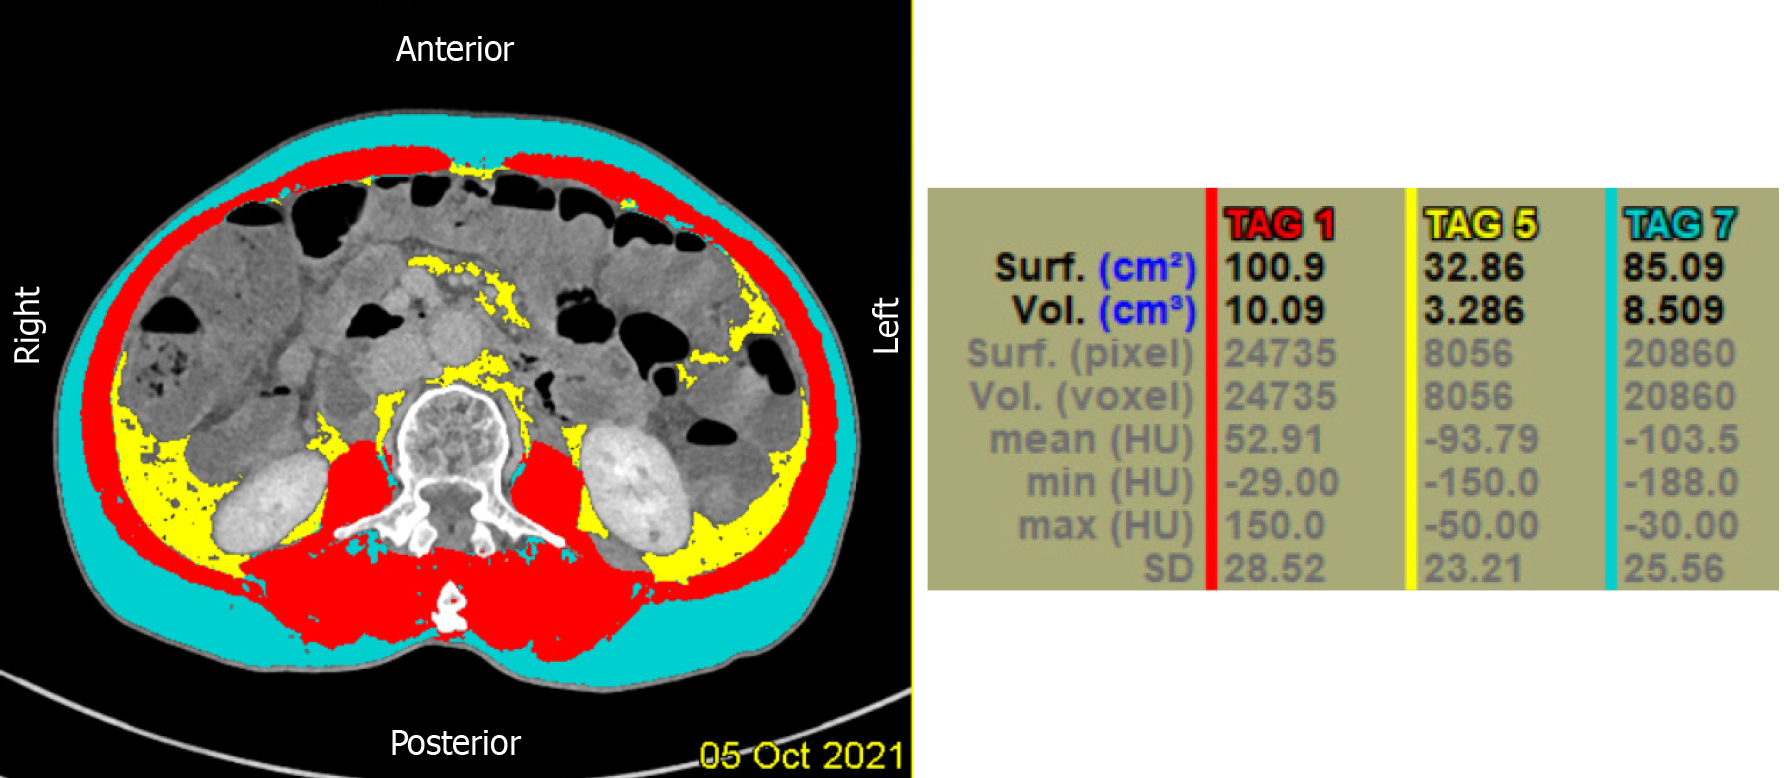
Figure 1 Measurement image of abdominal fat distribution.
The red, blue, and yellow areas indicate muscle, subcutaneous, and visceral fat, respectively. The software automatically identifies visceral and subcutaneous fat according to the selected area boundary and fat density range and completes the measurement of fat volume and average density, allowing the observer to correct the boundary.
- Citation: Li WF, Que CR, Xu DB, Li P. Impact of visceral fat distribution on postoperative complications in high-aged patients undergoing gastric cancer surgery: A cross-sectional study. World J Gastroenterol 2025; 31(22): 105201
- URL: https://www.wjgnet.com/1007-9327/full/v31/i22/105201.htm
- DOI: https://dx.doi.org/10.3748/wjg.v31.i22.105201


