
















©The Author(s) 2025.
World J Gastroenterol. Jan 7, 2025; 31(1): 96199
Published online Jan 7, 2025. doi: 10.3748/wjg.v31.i1.96199
Published online Jan 7, 2025. doi: 10.3748/wjg.v31.i1.96199
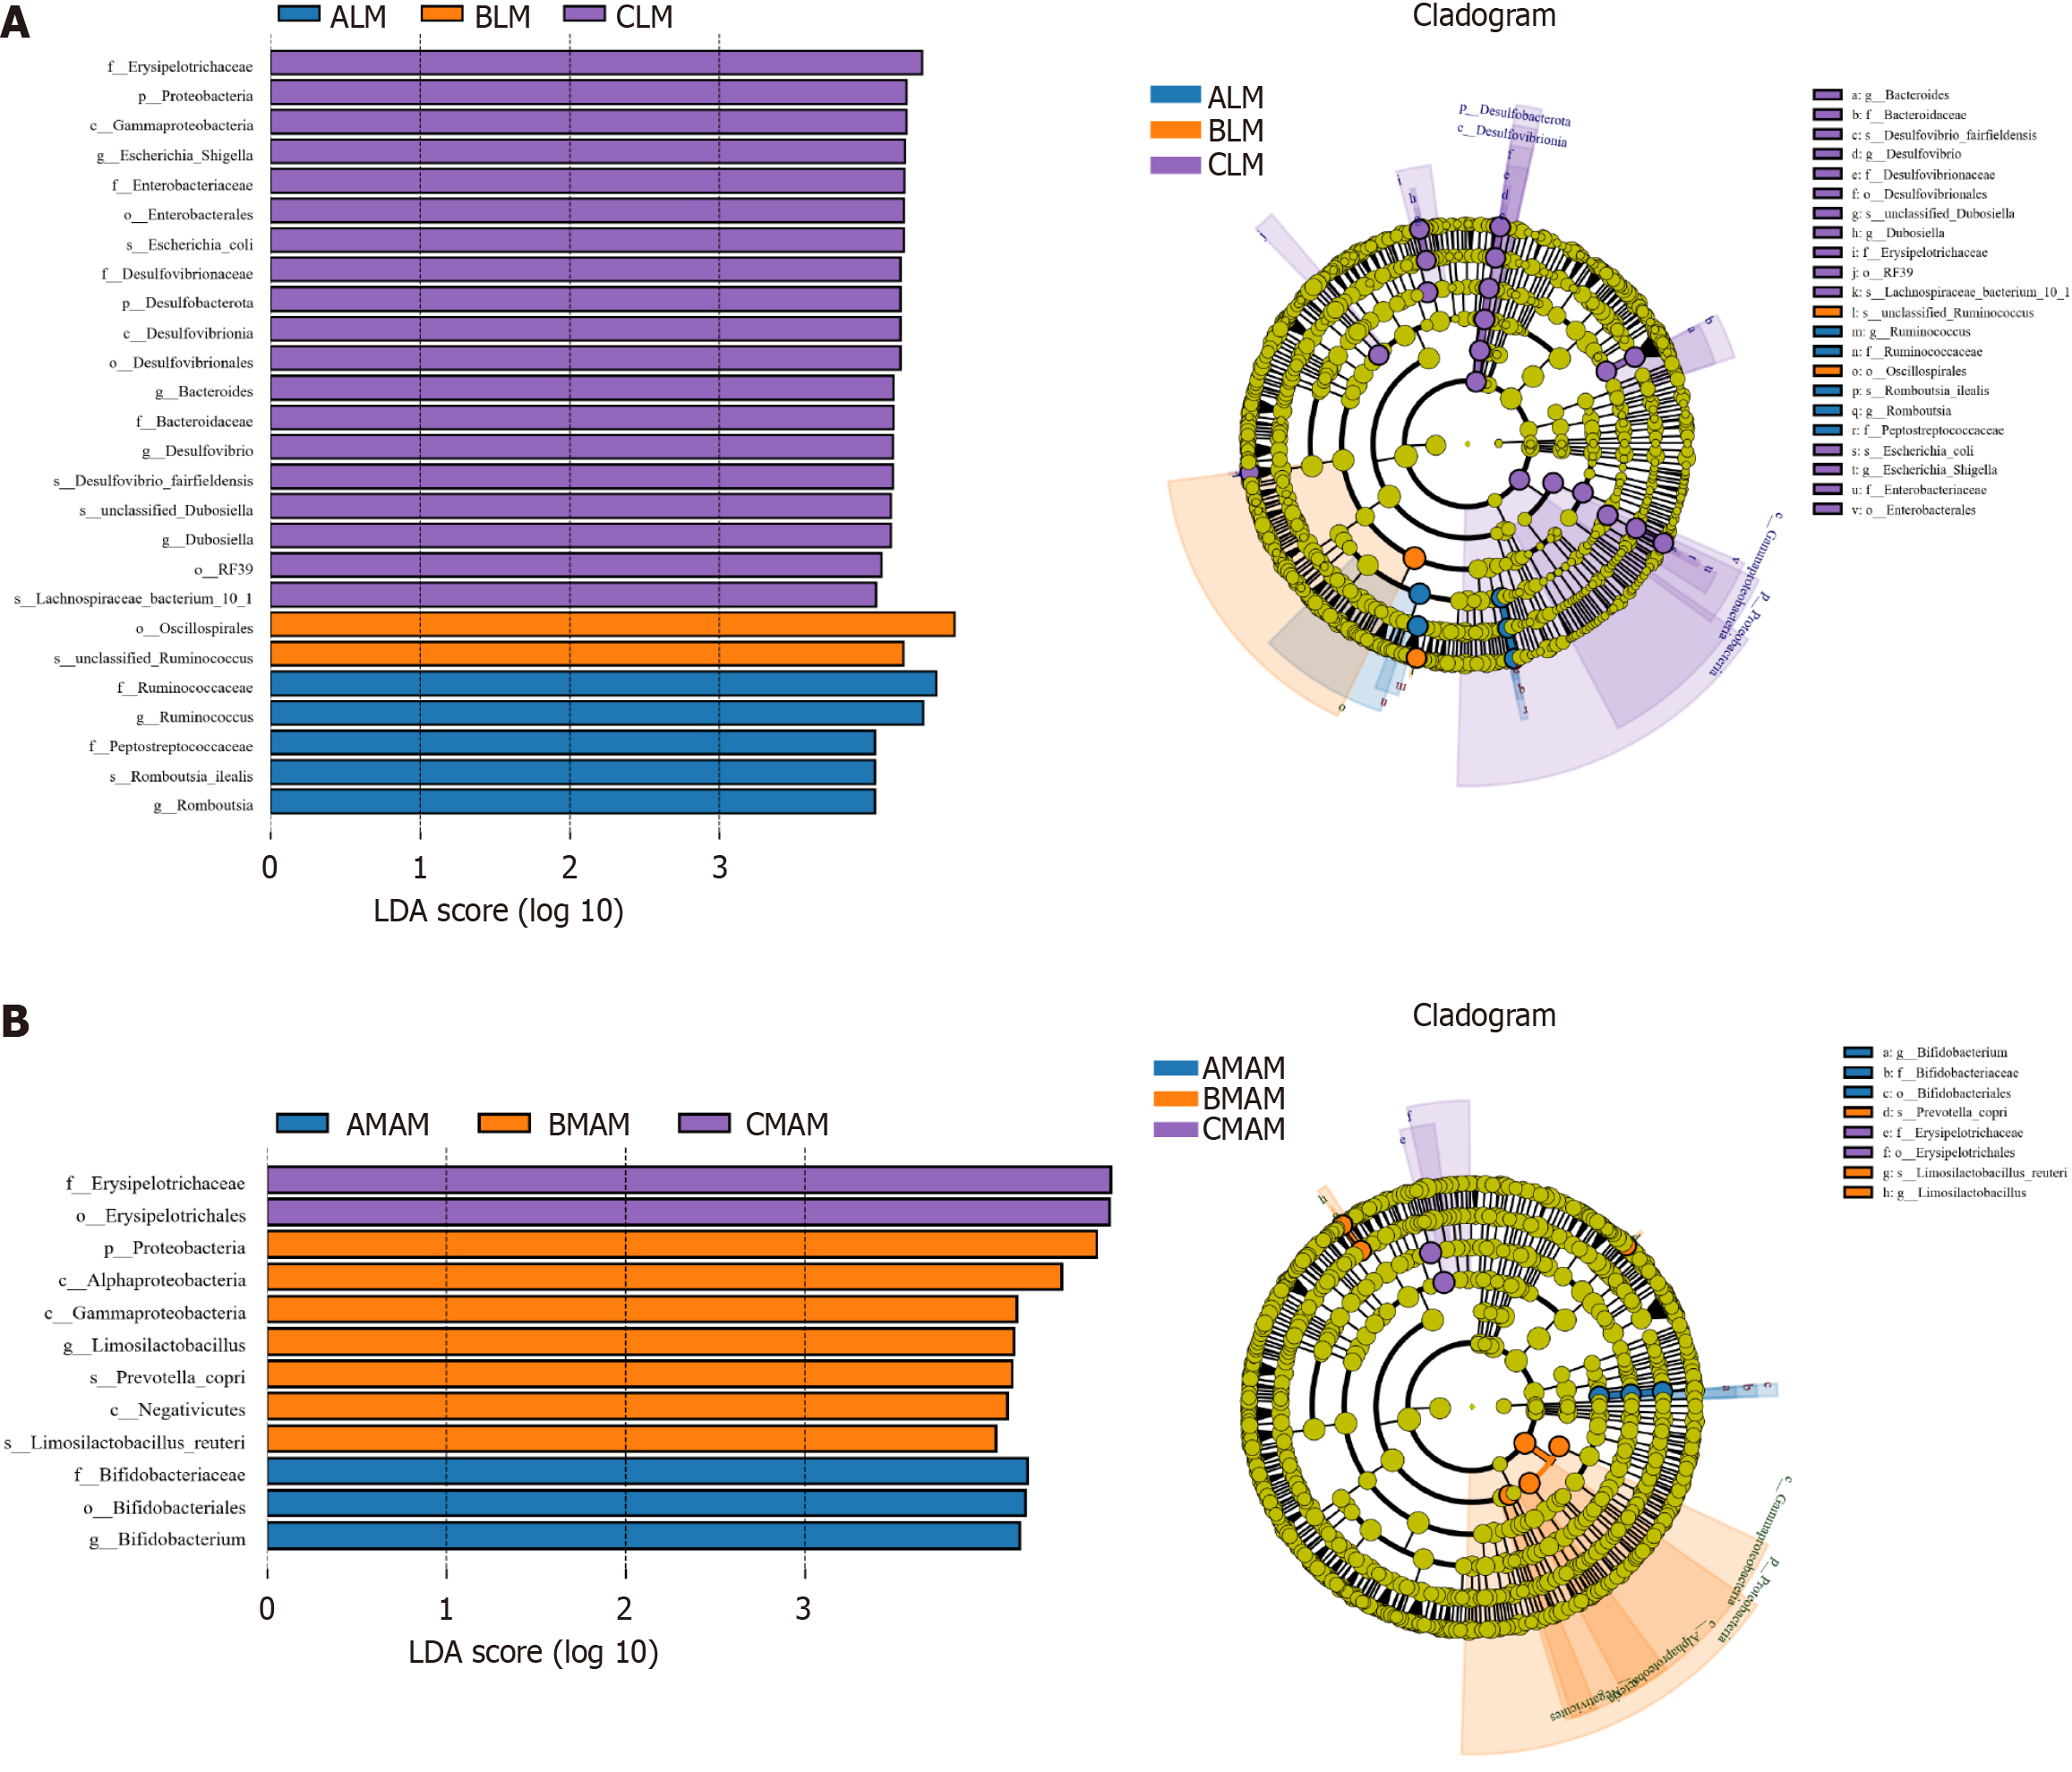
Figure 9 LDA distribution map (LDA > 4) and evolutionary branching map.
A: LDA distribution map (LDA > 4) and evolutionary branching map of intestinal luminal microbiota; B: LDA distribution map (LDA > 4) and evolutionary branching map of mucosa-associated microbiota. Blue represents species enriched in the control group (A), orange represents species enriched in the hanging tail group (B), and purple represents species enriched in the probiotic hanging tail group (C). LM: Mucosa-associated microbiota; MAM: Mucosa-associated microbiota; A, B, and C stand for control group, tail-hanging group, and tail-hanging to probiotics group, respectively.
- Citation: Zhang P, Zhu Y, Chen P, Zhou T, Han ZY, Xiao J, Ma JF, Ma W, Zang P, Chen Y. Effects of Bifidobacterium lactis BLa80 on fecal and mucosal flora and stem cell factor/c-kit signaling pathway in simulated microgravity rats. World J Gastroenterol 2025; 31(1): 96199
- URL: https://www.wjgnet.com/1007-9327/full/v31/i1/96199.htm
- DOI: https://dx.doi.org/10.3748/wjg.v31.i1.96199