
















©The Author(s) 2024.
World J Gastroenterol. Jun 7, 2024; 30(21): 2777-2792
Published online Jun 7, 2024. doi: 10.3748/wjg.v30.i21.2777
Published online Jun 7, 2024. doi: 10.3748/wjg.v30.i21.2777
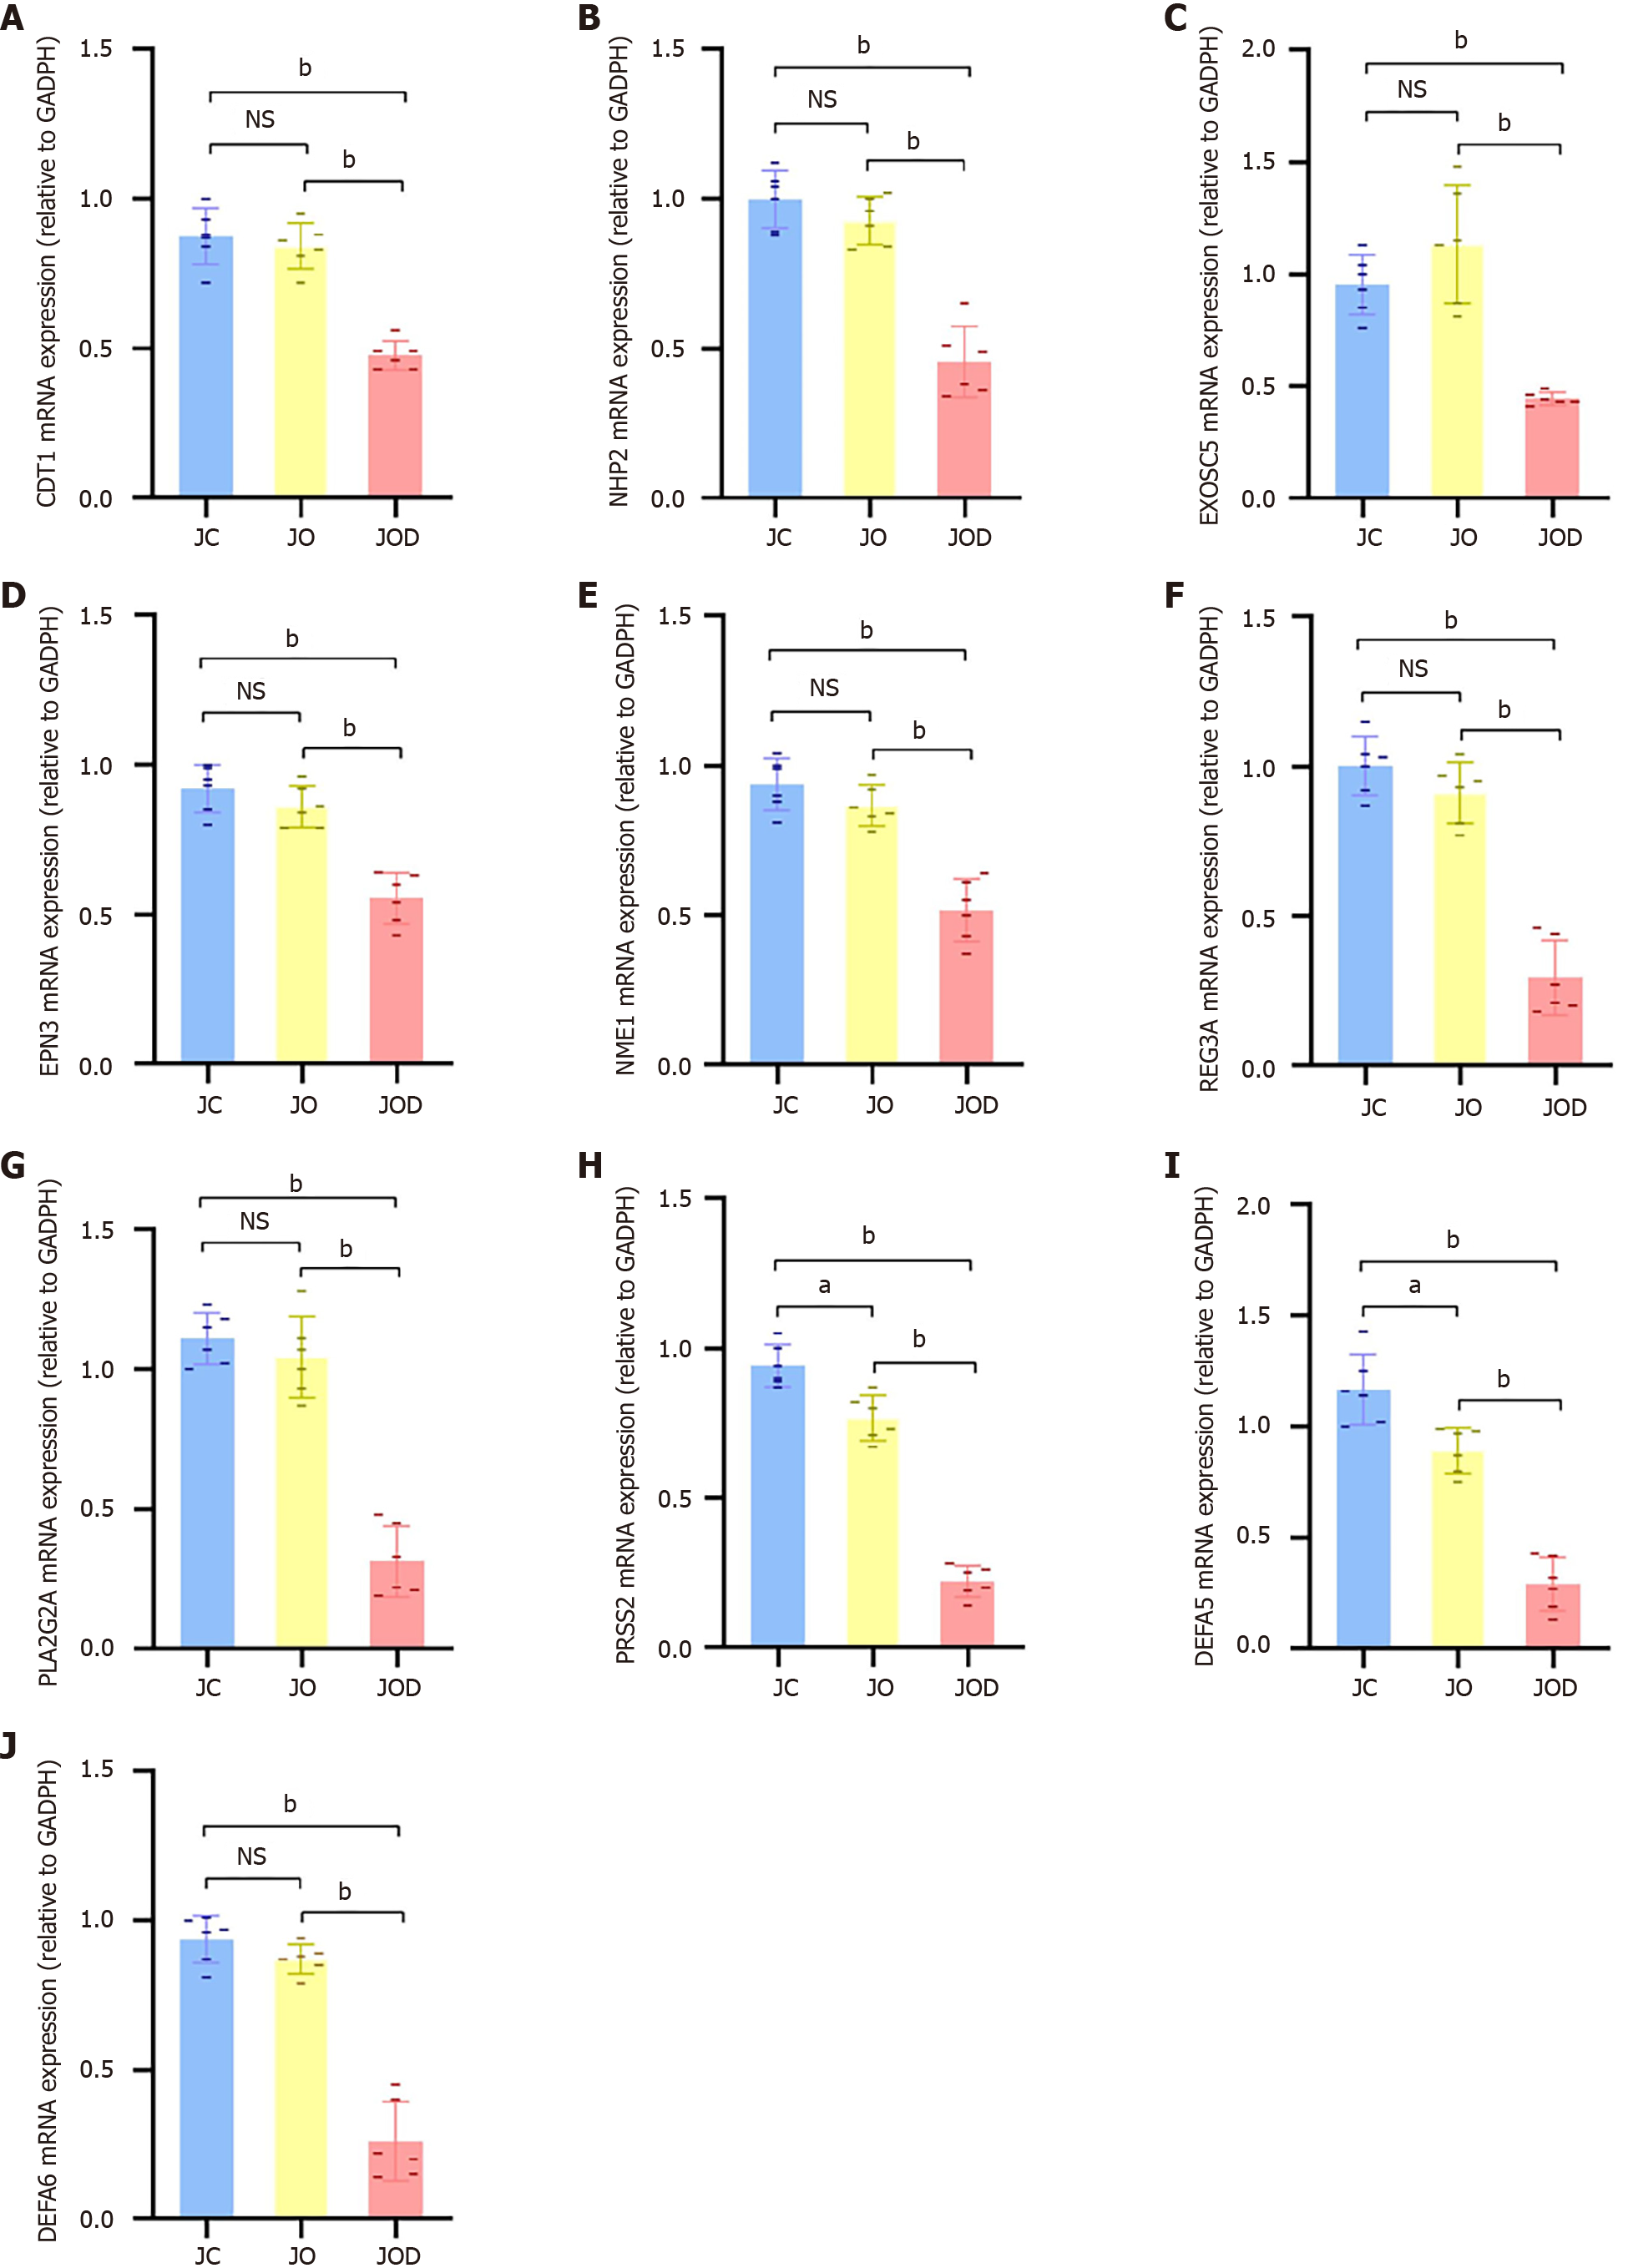
Figure 8 Validation of gene expression in jejunal mucosa by quantitative real-time PCR.
A-J: The relative mRNA expression of CDT1 (A), NHP2 (B), EXOSC5 (C), EPN3 (D), NME1 (E), REG3A (F), PLA2G2A (G), PRSS2 (H), DEFA5 (I), and DEFA6 (J) in jejunal mucosa from the JC group (n = 6), JO group (n = 6) and JOD group (n = 6). Data were expressed as mean ± SD. aP < 0.01, bP < 0.001. NS: Not significant.
- Citation: Niu XT, Wang XY, Wang Y, Han K, Ru N, Xiang JY, Linghu EQ. Transcriptome analysis suggests broad jejunal alterations in Linghu’s obesity-diarrhea syndrome: A pilot study. World J Gastroenterol 2024; 30(21): 2777-2792
- URL: https://www.wjgnet.com/1007-9327/full/v30/i21/2777.htm
- DOI: https://dx.doi.org/10.3748/wjg.v30.i21.2777