
















©The Author(s) 2023.
World J Gastroenterol. Feb 14, 2023; 29(6): 1076-1089
Published online Feb 14, 2023. doi: 10.3748/wjg.v29.i6.1076
Published online Feb 14, 2023. doi: 10.3748/wjg.v29.i6.1076
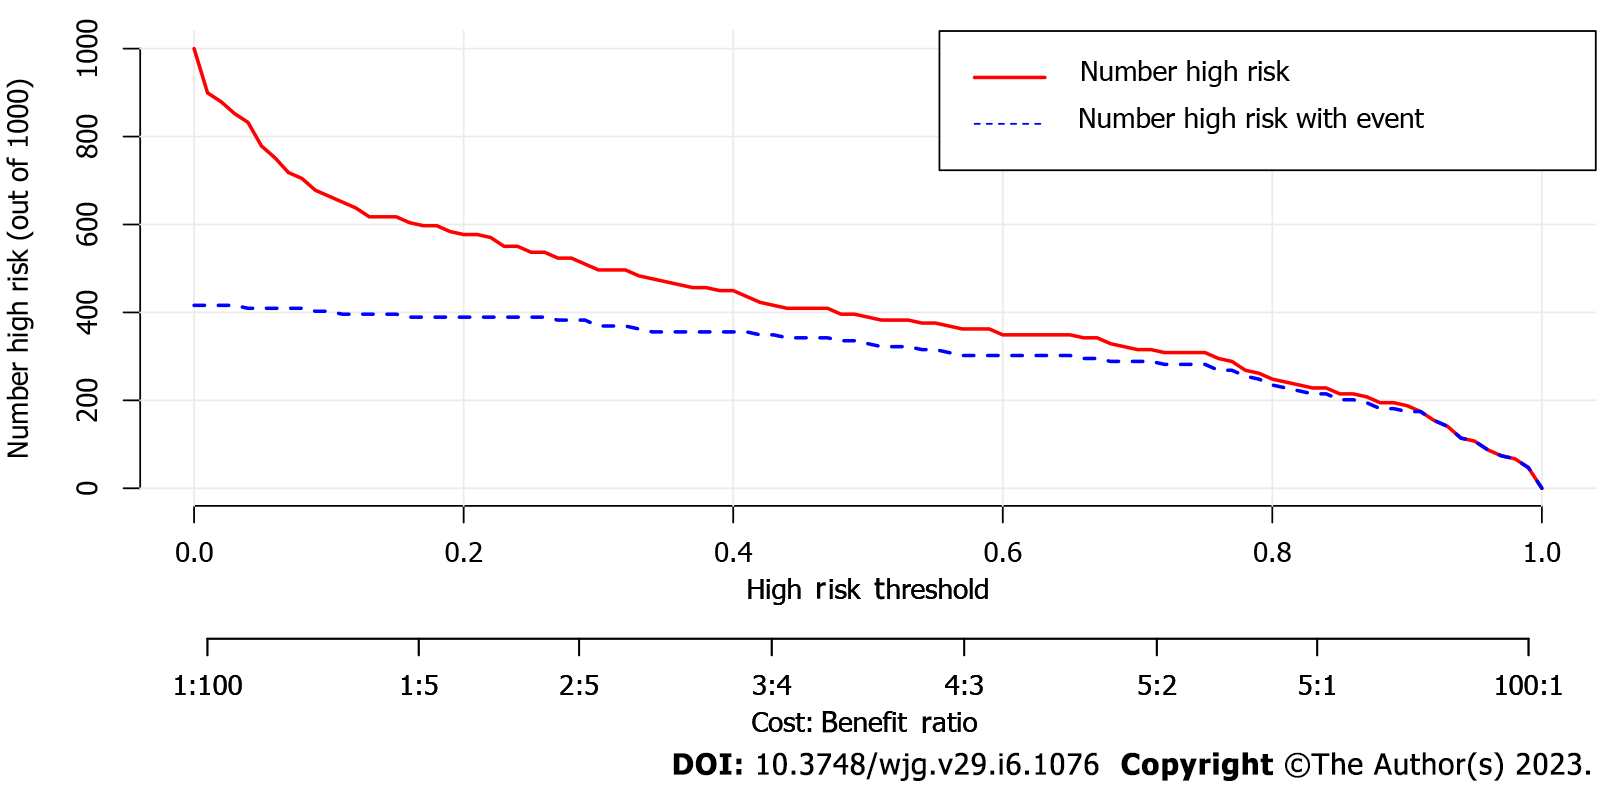
Figure 7 Clinical impact curve of the nomogram for 1,000 simulated samples.
The blue dashed line is the actual high-risk number, and the red line is the high-risk number based on the nomogram. The nomogram predicted a probability of the event that corresponded closely to its actual high risk when the risk threshold was between 0.4 and 0.8, and consistently when it exceeded 0.8.
- Citation: Luo R, Gao J, Gan W, Xie WB. Clinical-radiomics nomogram for predicting esophagogastric variceal bleeding risk noninvasively in patients with cirrhosis. World J Gastroenterol 2023; 29(6): 1076-1089
- URL: https://www.wjgnet.com/1007-9327/full/v29/i6/1076.htm
- DOI: https://dx.doi.org/10.3748/wjg.v29.i6.1076