
















©The Author(s) 2022.
World J Gastroenterol. Feb 14, 2022; 28(6): 653-664
Published online Feb 14, 2022. doi: 10.3748/wjg.v28.i6.653
Published online Feb 14, 2022. doi: 10.3748/wjg.v28.i6.653
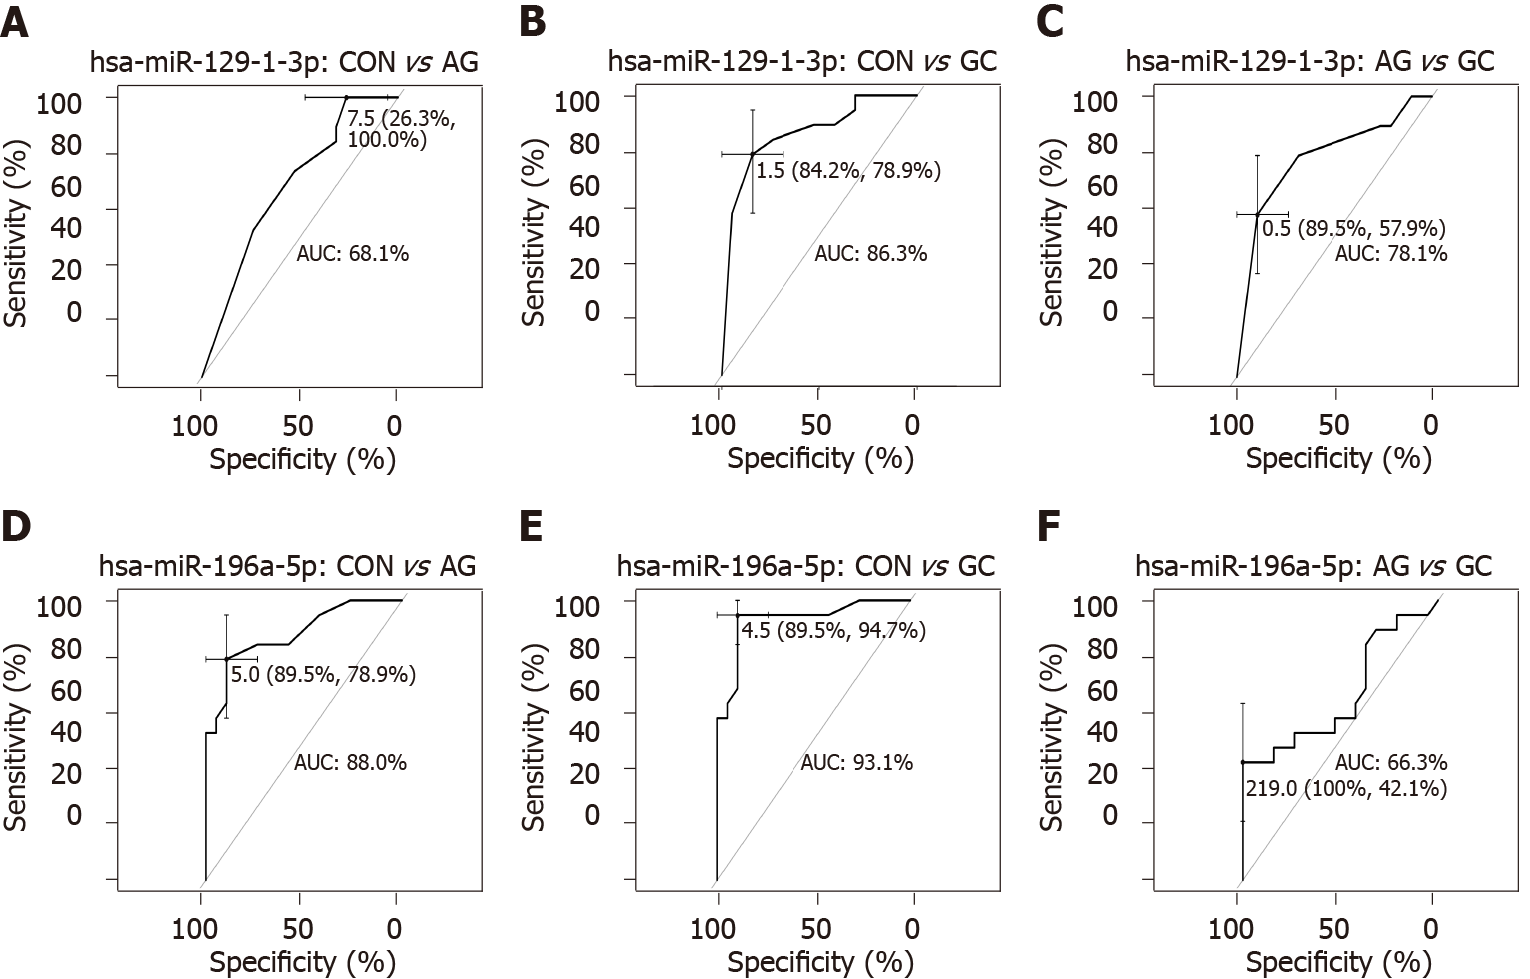
Figure 3 Receiver operating characteristic curves showing prediction performances of expression levels.
A-C: Hsa-miR-129-1-3p; D-F: Hsa-miR-196a-5p in tissue samples between different comparison groups: Control vs atrophic gastritis; control vs gastric cancer; and atrophic gastritis vs gastric cancer. AUC: Area under the curve; CON: Control; AG: Atrophic gastritis; GC: Gastric cancer.
- Citation: Varkalaite G, Vaitkeviciute E, Inciuraite R, Salteniene V, Juzenas S, Petkevicius V, Gudaityte R, Mickevicius A, Link A, Kupcinskas L, Leja M, Kupcinskas J, Skieceviciene J. Atrophic gastritis and gastric cancer tissue miRNome analysis reveals hsa-miR-129-1 and hsa-miR-196a as potential early diagnostic biomarkers. World J Gastroenterol 2022; 28(6): 653-664
- URL: https://www.wjgnet.com/1007-9327/full/v28/i6/653.htm
- DOI: https://dx.doi.org/10.3748/wjg.v28.i6.653