
















©The Author(s) 2022.
World J Gastroenterol. Feb 14, 2022; 28(6): 653-664
Published online Feb 14, 2022. doi: 10.3748/wjg.v28.i6.653
Published online Feb 14, 2022. doi: 10.3748/wjg.v28.i6.653
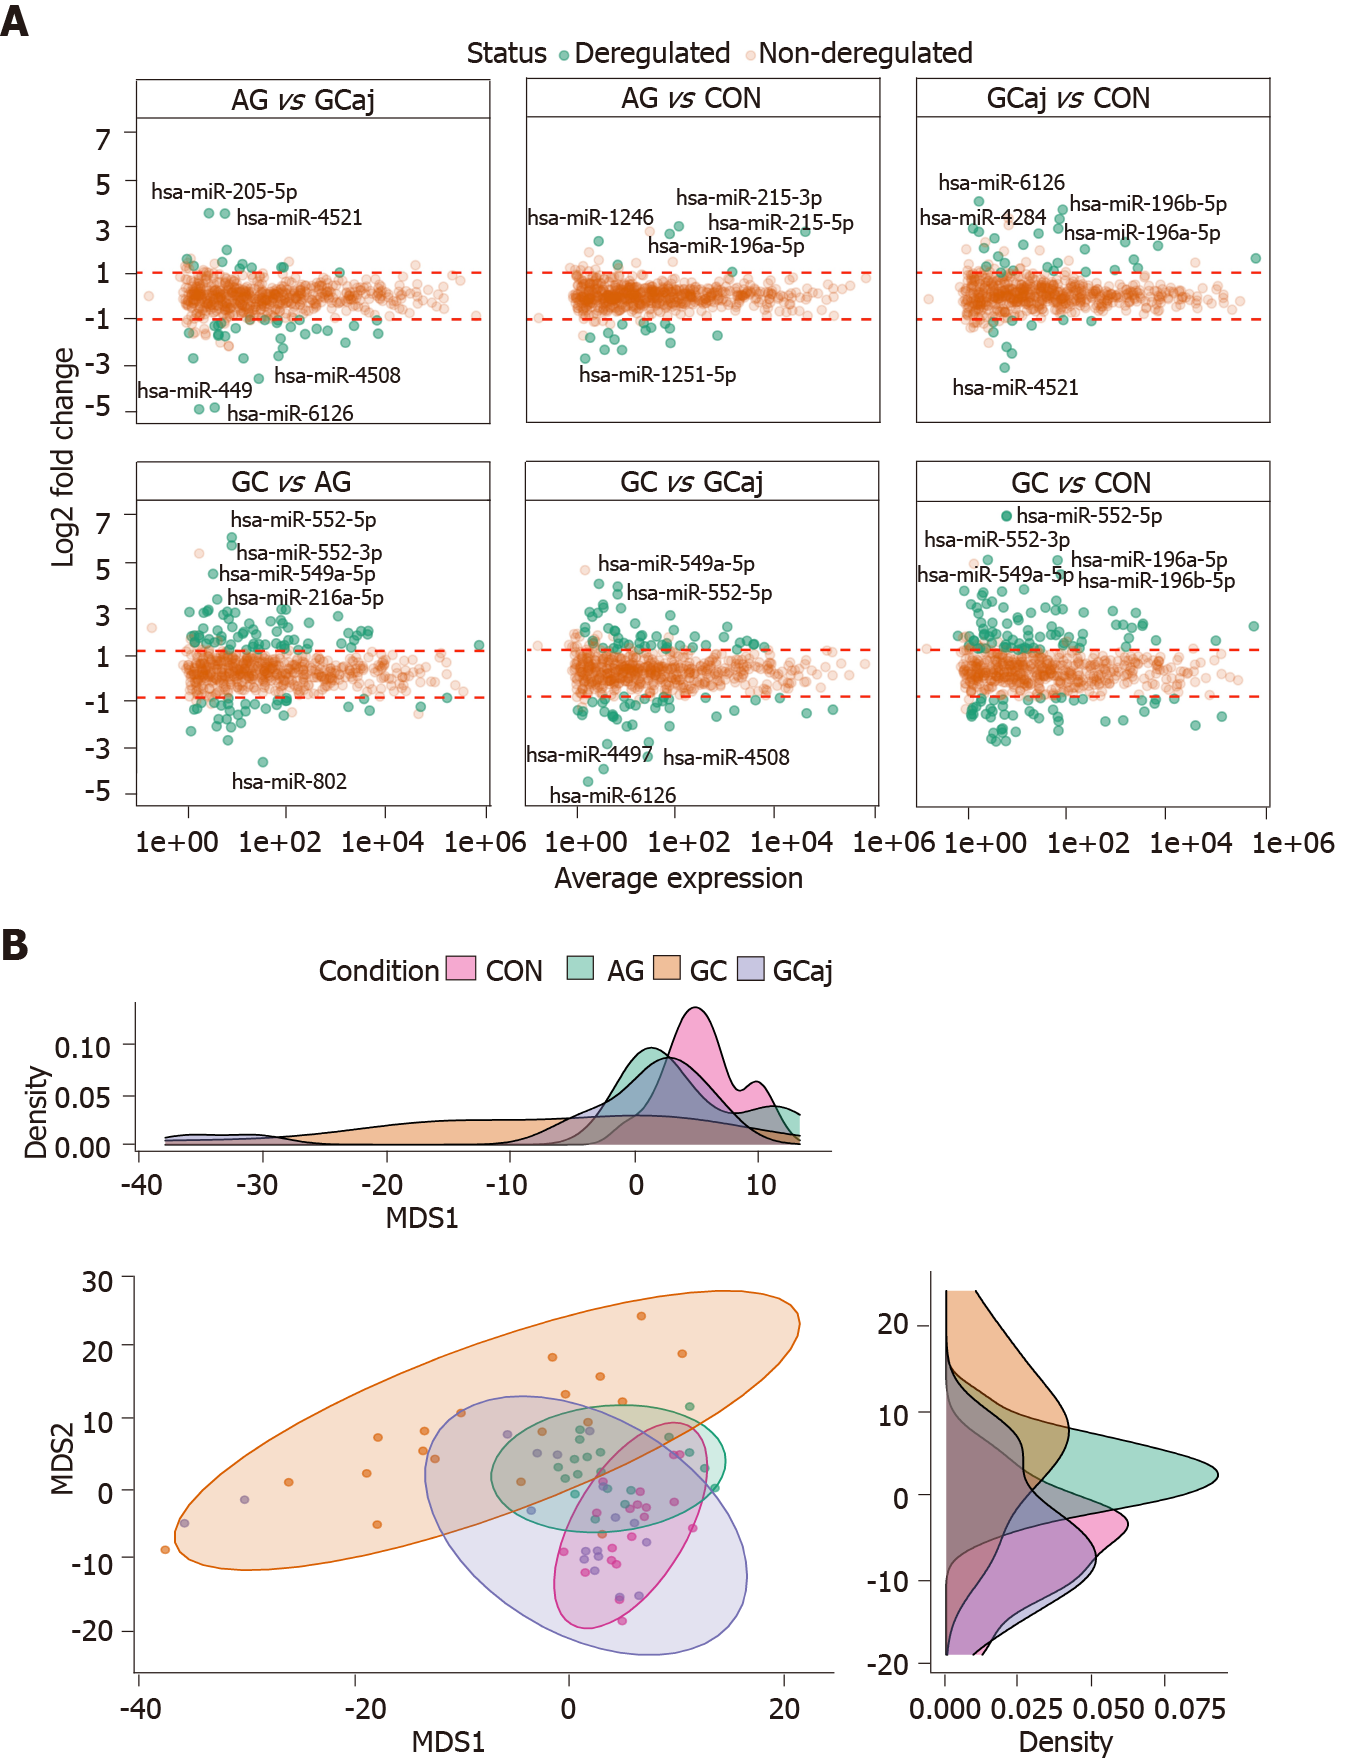
Figure 1 Results of microRNA differential expression analysis.
A: Differentially expressed gastric tissue microRNAs among different conditions. P-adjusted < 0.05 and |log2 fold change| > 1; B: Multidimensional scaling plot based on normalized data showing a clustering corresponding to control, atrophic gastritis, gastric cancerous and adjacent tissues. The density plots show distributions of the first and second dimensions. CON: Control; AG: Atrophic gastritis; GC: Gastric cancerous; GCaj: Gastric adjacent tissue; MDS: Multidimensional scaling.
- Citation: Varkalaite G, Vaitkeviciute E, Inciuraite R, Salteniene V, Juzenas S, Petkevicius V, Gudaityte R, Mickevicius A, Link A, Kupcinskas L, Leja M, Kupcinskas J, Skieceviciene J. Atrophic gastritis and gastric cancer tissue miRNome analysis reveals hsa-miR-129-1 and hsa-miR-196a as potential early diagnostic biomarkers. World J Gastroenterol 2022; 28(6): 653-664
- URL: https://www.wjgnet.com/1007-9327/full/v28/i6/653.htm
- DOI: https://dx.doi.org/10.3748/wjg.v28.i6.653