
















©The Author(s) 2022.
World J Gastroenterol. Jul 14, 2022; 28(26): 3116-3131
Published online Jul 14, 2022. doi: 10.3748/wjg.v28.i26.3116
Published online Jul 14, 2022. doi: 10.3748/wjg.v28.i26.3116
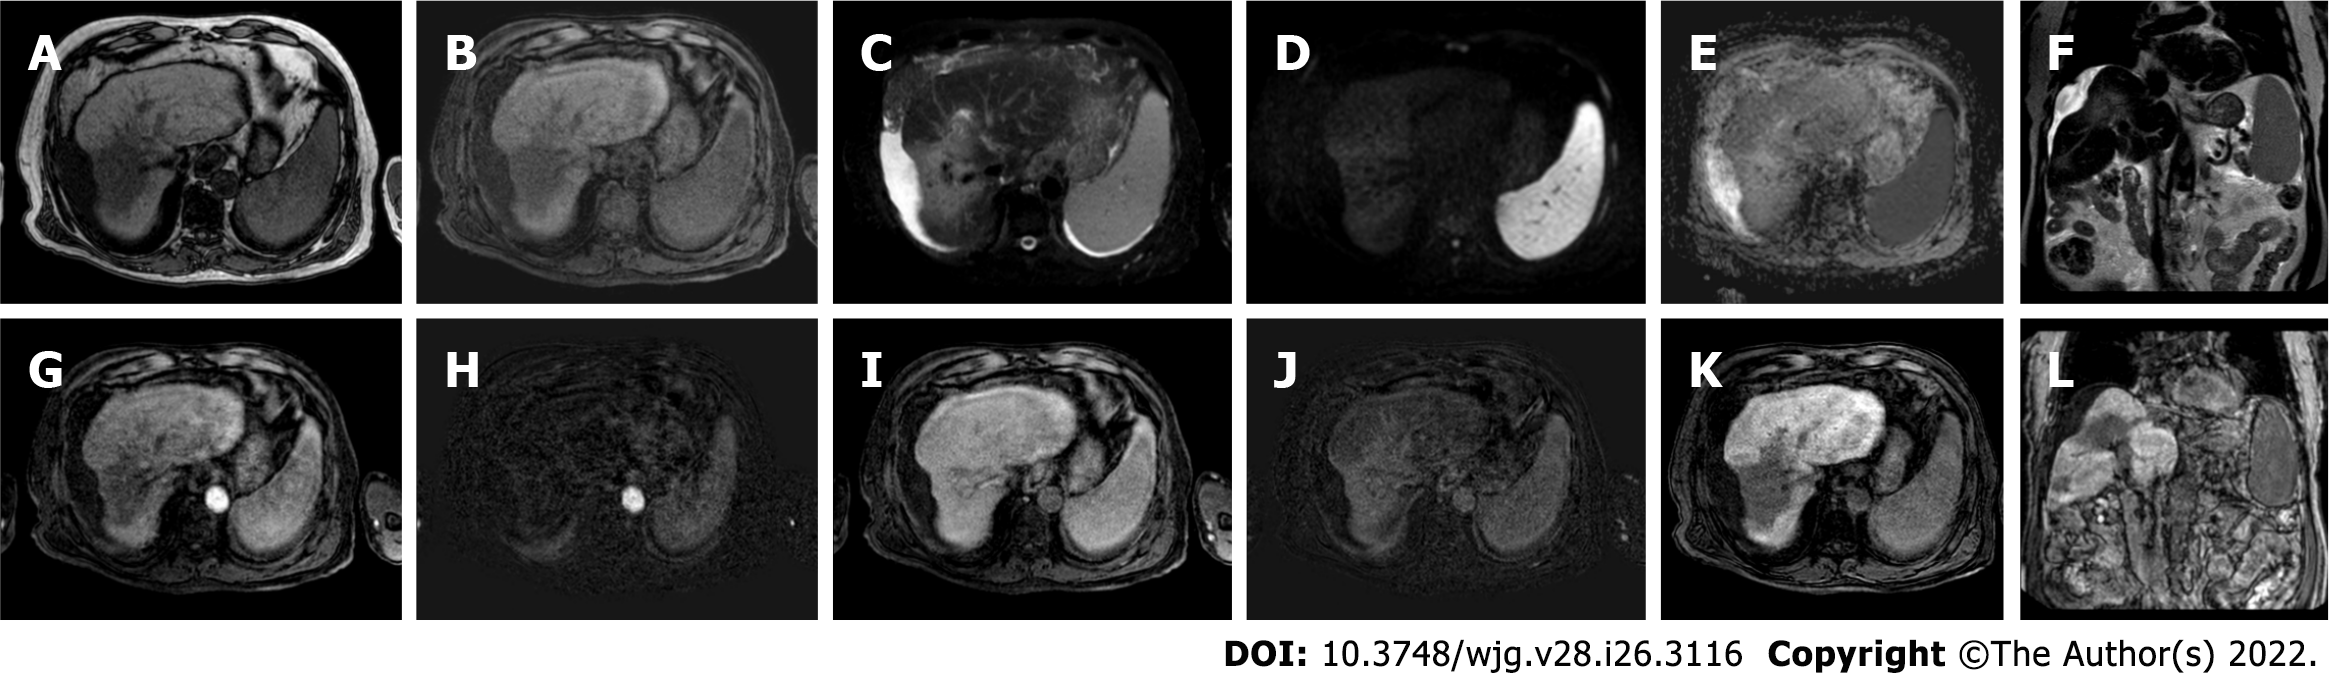
Figure 11 Follow-up liver magnetic resonance imaging of abovementioned patient (Figures 8-10), 20 mo after stereotactic body radiation therapy.
A: Out-phase T1-weighted image; B: Non contrast T1-weighted high resolution isotropic volume examination; C: T2-spectral attenuated inversion recovery; D: High b-value diffusion weighted imaging; E: Apparent diffusion coefficient map; F: T2-weighted image; G: Arterial phase magnetic resonance imaging (MRI); H: Arterial phase MRI with image subtraction technique; I: Portal venous phase MRI; J: Portal venous phase MRI with image subtraction technique; K and L: Hepatobiliary phase MRI. MRI revealed parenchymal retraction with signal hypointensity on T1-weighted images corresponding to inhomogeneous hyperintensity in axial and coronal T2 sequences, with no significant increase in diffusion signal. Dynamic perfusion study after contrast medium administration: no enhancement in arterial phase and a progressive enhancement in delayed phase with corresponding hypointense signal in the hepatobiliary excretion phase testifying the fibrotic evolution of the treated liver and the absence of locoregional recurrence.
- Citation: Gatti M, Maino C, Darvizeh F, Serafini A, Tricarico E, Guarneri A, Inchingolo R, Ippolito D, Ricardi U, Fonio P, Faletti R. Role of gadoxetic acid-enhanced liver magnetic resonance imaging in the evaluation of hepatocellular carcinoma after locoregional treatment. World J Gastroenterol 2022; 28(26): 3116-3131
- URL: https://www.wjgnet.com/1007-9327/full/v28/i26/3116.htm
- DOI: https://dx.doi.org/10.3748/wjg.v28.i26.3116