
















©The Author(s) 2022.
World J Gastroenterol. Jun 28, 2022; 28(24): 2689-2704
Published online Jun 28, 2022. doi: 10.3748/wjg.v28.i24.2689
Published online Jun 28, 2022. doi: 10.3748/wjg.v28.i24.2689
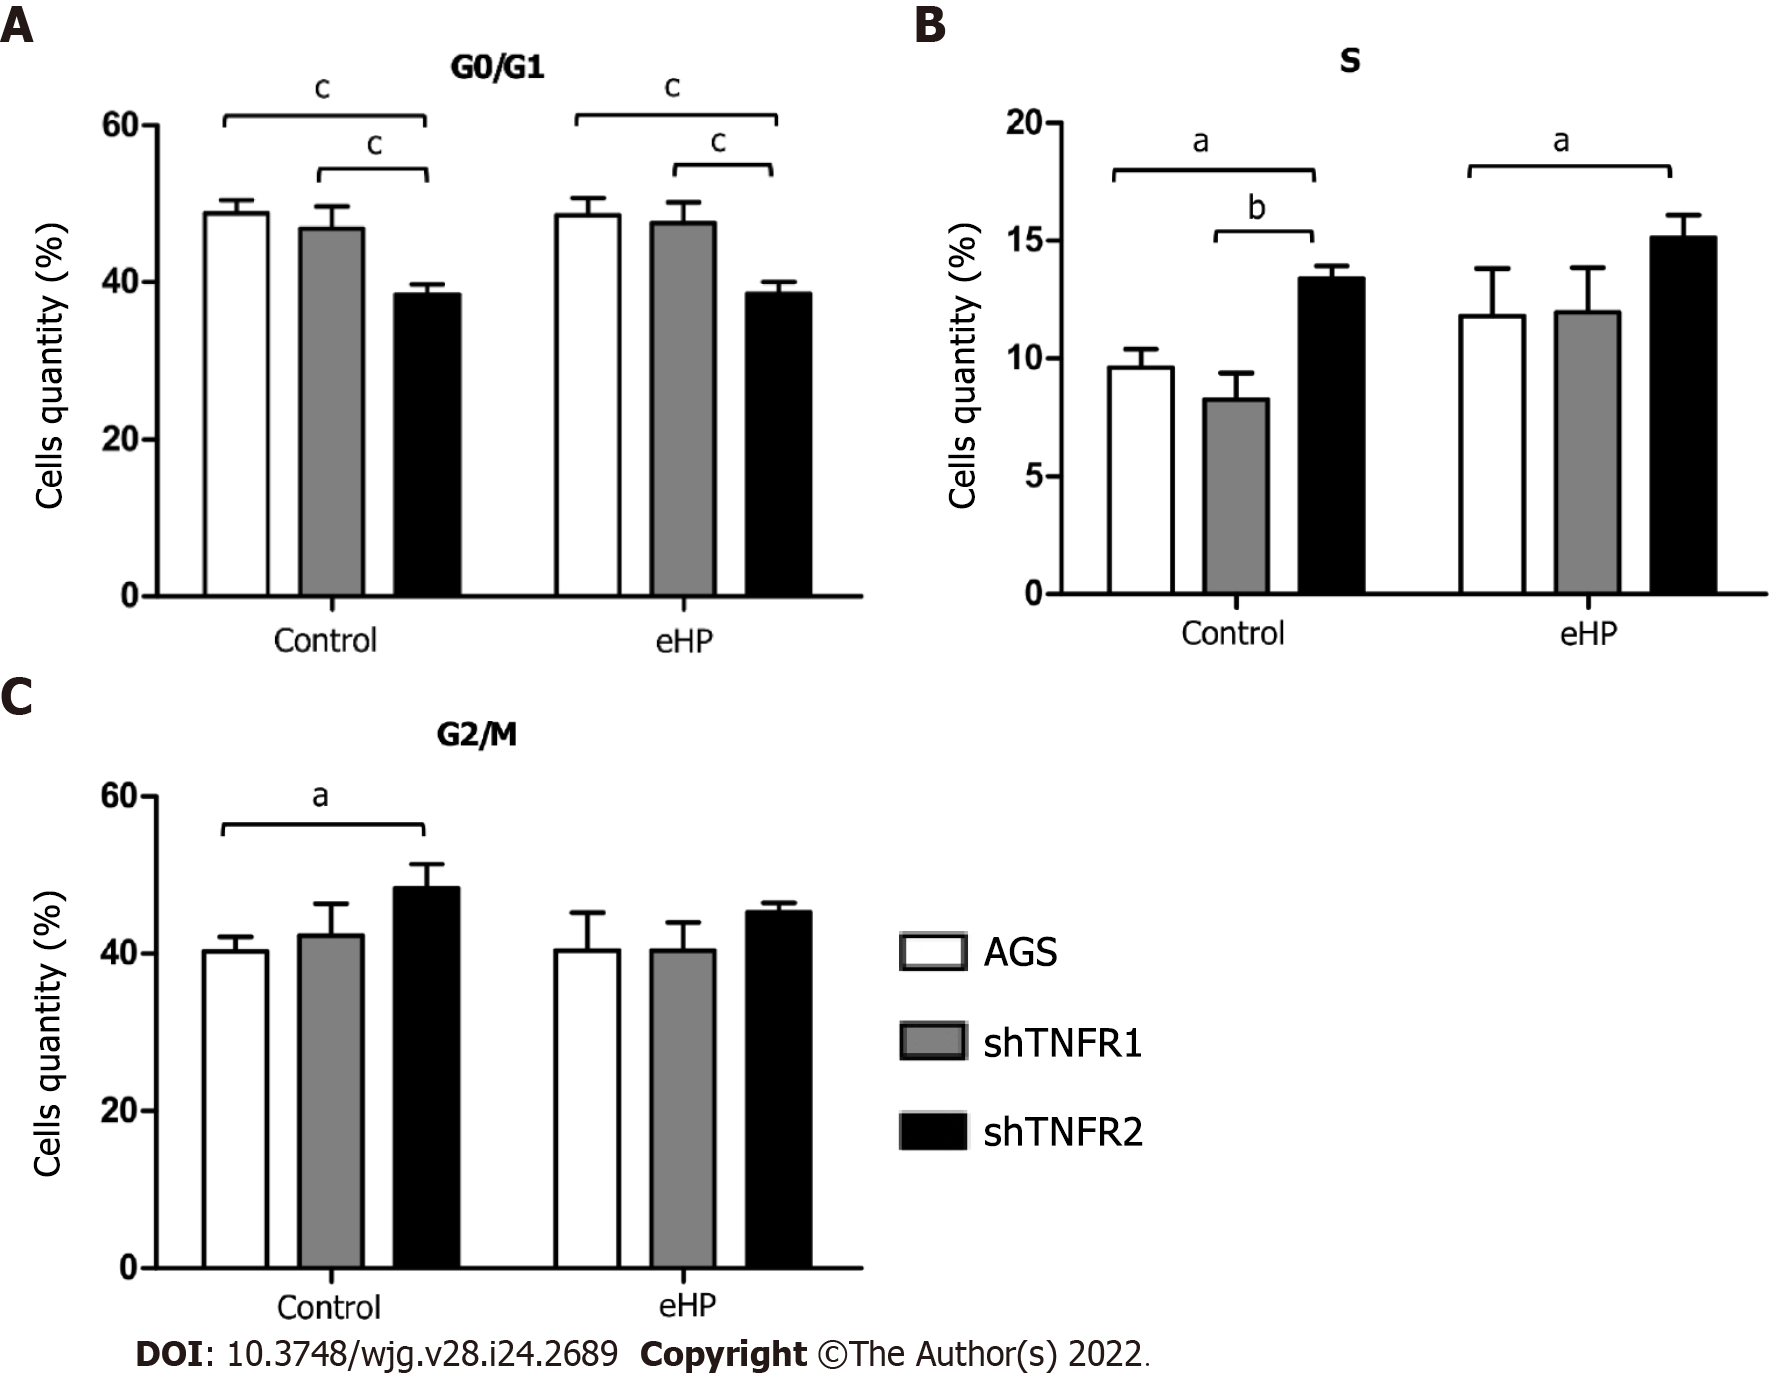
Figure 4 Cell cycle distribution analysis.
Number of cells in the G0/G1, S and G2/M phases of the cell cycle in nonsilenced AGS cells, cells with TNFR1 downregulated (shTNFR1), and cells with TNFR2 downregulated (shTNFR2) without additional treatment (control) and those treated with the Helicobacter pylori extract. A: G0/G1; B: S; C: G2/M. Bars represent the mean ± SD from three independent trials. Statistically significant difference: aP < 0.05; bP < 0.01; cP < 0.001. eHP: Helicobacter pylori extract.
- Citation: Rossi AFT, da Silva Manoel-Caetano F, Biselli JM, Cabral ÁS, Saiki MFC, Ribeiro ML, Silva AE. Downregulation of TNFR2 decreases survival gene expression, promotes apoptosis and affects the cell cycle of gastric cancer cells. World J Gastroenterol 2022; 28(24): 2689-2704
- URL: https://www.wjgnet.com/1007-9327/full/v28/i24/2689.htm
- DOI: https://dx.doi.org/10.3748/wjg.v28.i24.2689