
















©The Author(s) 2020.
World J Gastroenterol. Jan 21, 2020; 26(3): 335-352
Published online Jan 21, 2020. doi: 10.3748/wjg.v26.i3.335
Published online Jan 21, 2020. doi: 10.3748/wjg.v26.i3.335
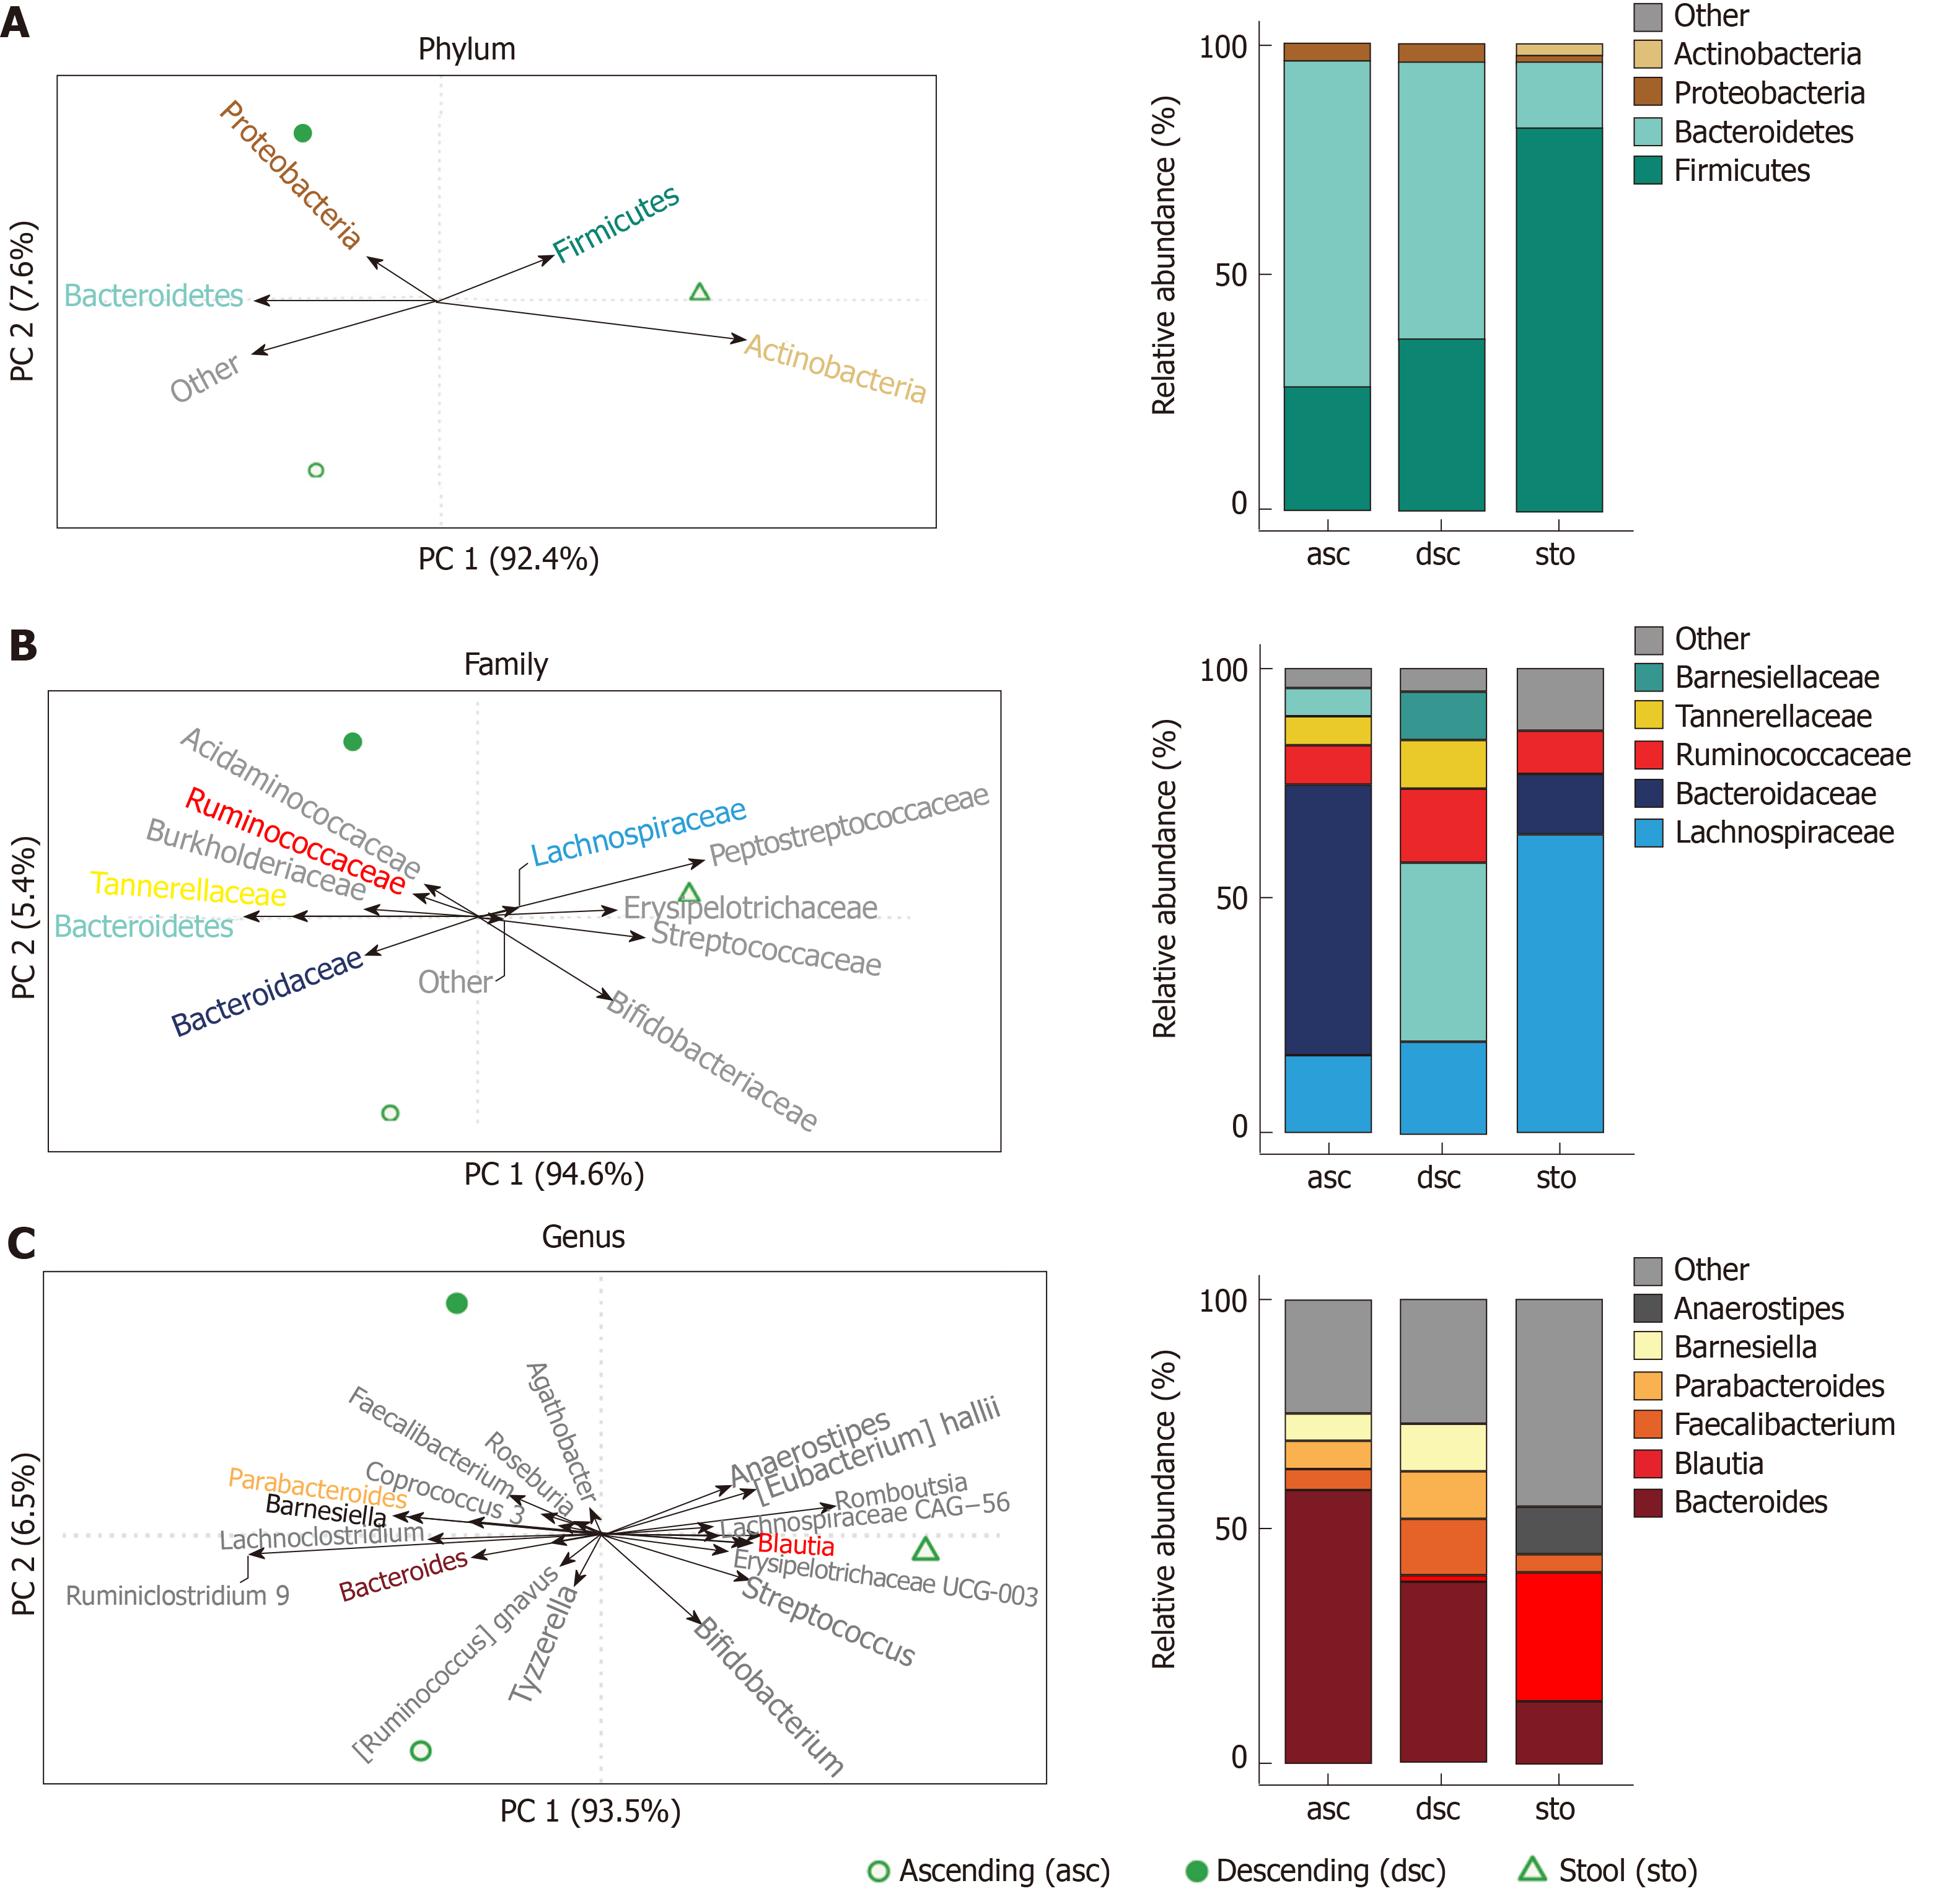
Figure 4 Composition of microbiota from stool, ascending and descending colon in a healthy, normal weight adult.
Left side shows principal components analysis biplots of centred log-ratio transformed relative abundances at the phylum; A: Family; B: Genus; C: Levels. Lines with arrows represent individual taxa. Right side shows relative abundance bar charts for the most abundant taxa at the respective taxonomic level across stool and colon location sample types.
- Citation: Baxter BA, Parker KD, Nosler MJ, Rao S, Craig R, Seiler C, Ryan EP. Metabolite profile comparisons between ascending and descending colon tissue in healthy adults. World J Gastroenterol 2020; 26(3): 335-352
- URL: https://www.wjgnet.com/1007-9327/full/v26/i3/335.htm
- DOI: https://dx.doi.org/10.3748/wjg.v26.i3.335