
















©The Author(s) 2016.
World J Gastroenterol. Apr 28, 2016; 22(16): 4168-4182
Published online Apr 28, 2016. doi: 10.3748/wjg.v22.i16.4168
Published online Apr 28, 2016. doi: 10.3748/wjg.v22.i16.4168
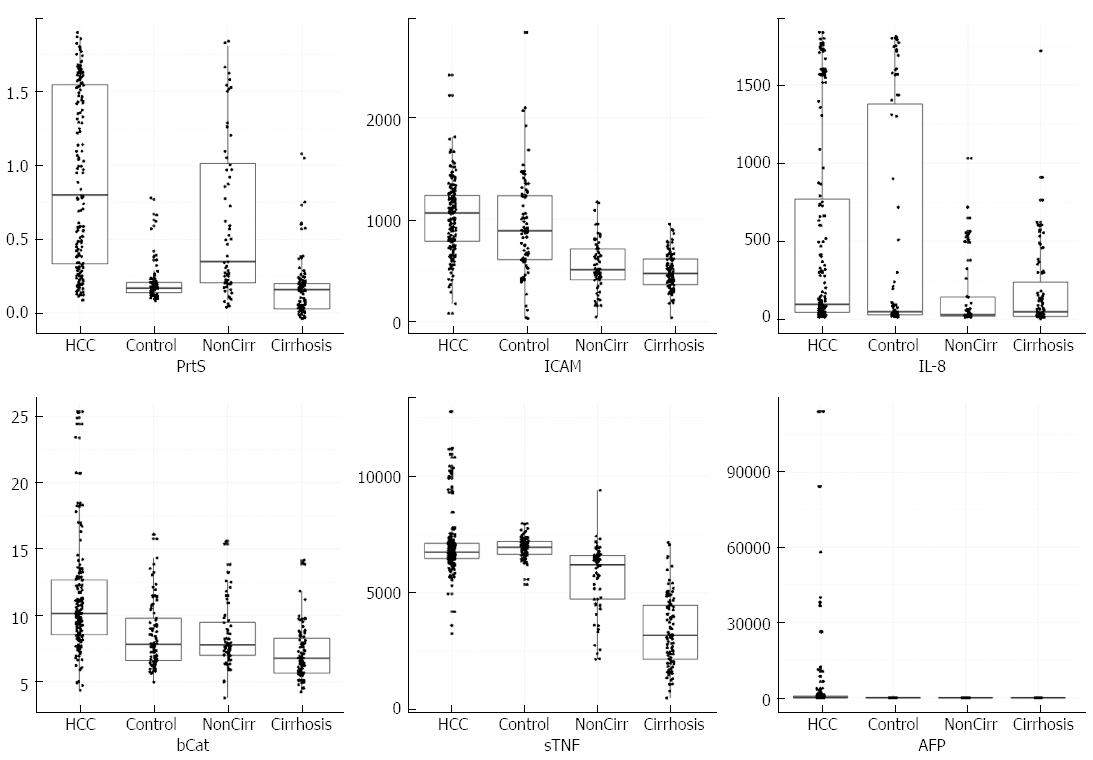
Figure 1 Box plots with scattered measurement points showing distribution of measured serum markers levels in different investigated groups.
Sample groups on x axis and protein concentrations on Y axis. The markers from left to right are proteosome (PrtS), ICAM (sICAM-1), IL-8, β-catenin (bCat), sTNF-RII (sTNF), and AFP. The box defines the boundaries of the first and third quartiles of data and the median values are indicated by horizontal lines within the boxes.
- Citation: Zekri ARN, Youssef ASED, Bakr YM, Gabr RM, Ahmed OS, Elberry MH, Mayla AM, Abouelhoda M, Bahnassy AA. Early detection of hepatocellular carcinoma co-occurring with hepatitis C virus infection: A mathematical model. World J Gastroenterol 2016; 22(16): 4168-4182
- URL: https://www.wjgnet.com/1007-9327/full/v22/i16/4168.htm
- DOI: https://dx.doi.org/10.3748/wjg.v22.i16.4168