
















©The Author(s) 2015.
World J Gastroenterol. Jan 28, 2015; 21(4): 1357-1361
Published online Jan 28, 2015. doi: 10.3748/wjg.v21.i4.1357
Published online Jan 28, 2015. doi: 10.3748/wjg.v21.i4.1357
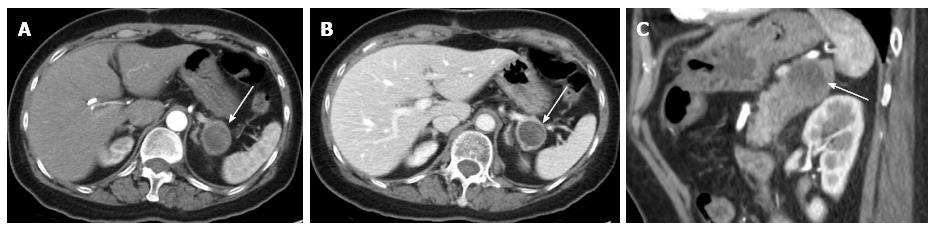
Figure 2 Follow-up computed tomography imaging 13 mo later.
The arterial phase (A), portal venous phase (B) and oblique sagittal contrast-enhanced computed tomography image (C) showed the lesion grew up to 2.9 cm in diameter with heterogeneous enhancement in the more thickened wall and solid component.
- Citation: Shi HY, Xie J, Miao F. Pancreatic carcinosarcoma: First literature report on computed tomography imaging. World J Gastroenterol 2015; 21(4): 1357-1361
- URL: https://www.wjgnet.com/1007-9327/full/v21/i4/1357.htm
- DOI: https://dx.doi.org/10.3748/wjg.v21.i4.1357