
















©2013 Baishideng Publishing Group Co.
World J Gastroenterol. Jun 21, 2013; 19(23): 3634-3641
Published online Jun 21, 2013. doi: 10.3748/wjg.v19.i23.3634
Published online Jun 21, 2013. doi: 10.3748/wjg.v19.i23.3634
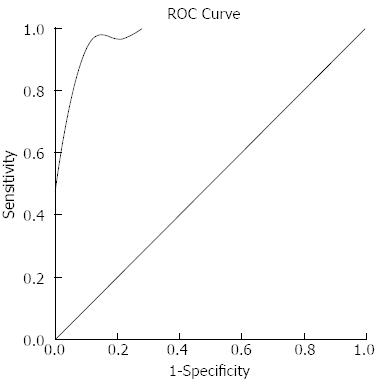
Figure 6 Receiver operating characteristic curve analysis result.
Receiver operating characteristic (ROC) curve analysis revealed that when values were more than or equal 28 HU they were considered diagnostic for focal autoimmune pancreatitis, and a sensitivity of 87.5%, a specificity of 100%, and an area under the ROC curve of 0.974 (95%CI: 0.928-1.021) were achieved.
- Citation: Sun GF, Zuo CJ, Shao CW, Wang JH, Zhang J. Focal autoimmune pancreatitis: Radiological characteristics help to distinguish from pancreatic cancer. World J Gastroenterol 2013; 19(23): 3634-3641
- URL: https://www.wjgnet.com/1007-9327/full/v19/i23/3634.htm
- DOI: https://dx.doi.org/10.3748/wjg.v19.i23.3634