
















©2012 Baishideng Publishing Group Co.
World J Gastroenterol. Feb 14, 2012; 18(6): 570-575
Published online Feb 14, 2012. doi: 10.3748/wjg.v18.i6.570
Published online Feb 14, 2012. doi: 10.3748/wjg.v18.i6.570
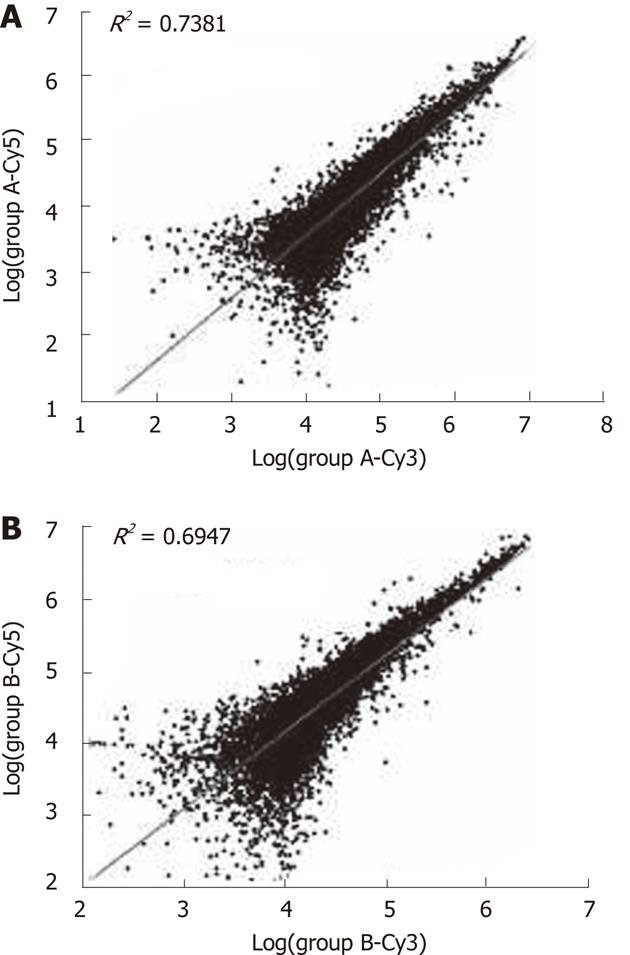
Figure 1 Correlation of CY5/CY3 hybridization signal intensity of all gene spots in Group A (polyps vs normal) and B (colorectal cancer vs normal) (R = 0.
8591 and 0.8335, respectively). For visualization of these gene distributions, dispersion plots containing the log2 (normal tissues) and log2 (polyps or colorectal cancer) values were constructed.
- Citation: Dai YC, Zhu XS, Nan QZ, Chen ZX, Xie JP, Fu YK, Lin YY, Lian QN, Sang QF, Zhan XJ. Identification of differential gene expressions in colorectal cancer and polyp by cDNA microarray. World J Gastroenterol 2012; 18(6): 570-575
- URL: https://www.wjgnet.com/1007-9327/full/v18/i6/570.htm
- DOI: https://dx.doi.org/10.3748/wjg.v18.i6.570